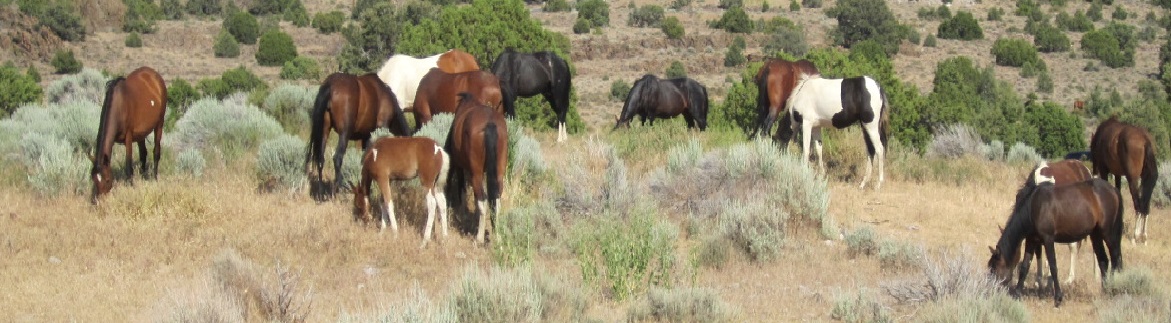
No activity has been reported since September 29, when gather ops commenced at Coyote Lake.
Author: Western Horse Watchers
Owyhee Roundup Announced
The incident will begin on or about October 11, according to the new release.
It was on the schedule dated August 2 but was dropped from the current schedule, dated August 30.
Helicopters will push the horses into the traps and the operation will be open to public observation. Five HMAs are involved.
The capture goal is 947 and the removal goal is 615. Mares returned to the Complex will be treated with PZP.
The Complex covers about one million acres and has an AML of 999, as shown in Table 1 of the Final EA for resource enforcement actions therein. The stocking rate allowed by plan is one wild horse per thousand acres, in line with the target rate across all HMAs.
The pre-gather population was estimated to be 1,188.

The Complex intersects six grazing allotments, listed in Table 5 of the EA. Figure 13 shows the arrangement. The image above is from the Western Watersheds map.
Captured animals will be taken to the Sutherland off-range corrals in Utah.
Gather stats and daily reports will be posted to this page.
The EA was posted with other project documents in ePlanning.
Western Horse Watchers does not see the wisdom of mobilizing a contractor in an area that is only 20% above AML and almost certainly below the True AML.
Devil’s Garden Roundup Day 18
The incident began on September 16. Reports covering activity through October 3 have been posted to the Modoc news page:
- Type: Planned
- Method: Helicopter
- Horses captured: 298, up from 229 on Day 14
- Average daily take: 16.6
- Capture goal: 600
- Removal goal: 600
- Returned: 1, no change from Day 14
- Deaths: Unknown
- Shipped: Unknown
Foals represented 13.1% of the horses captured. Of the adults, 49.8% were males and 50.2% were female.
Body condition scores were not provided.
The death rate and number of unaccounted-for animals cannot be determined.
Other statistics:
- AML: 402
- Forage assigned to horses: 4,824 AUMs per year
- Pre-gather population: 1,926
- Forage liberated to date: 3,564 AUMs per year
- Water liberated to date: 2,970 gallons per day
- Forage assigned to livestock: 15,711 AUMs per year (estimated)
- Horses displaced from WHT by livestock: 1,309 (2.6% of off-range holding)
- True AML: 1,711
RELATED: Devil’s Garden Roundup Day 14.
Problems Continue at RAS
The Allotment Information Report shows 1,555,088 AUMs per year assigned to RSGA, instigator of the consent decree, but the Allotment Master report shows 97,193.

The Rock Springs allotment covers about two million acres of public and private lands in the Wyoming checkerboard and is administered by the Rock Springs Field Office.
RELATED: More Problems at RAS.
Coalition Still Trying to Eradicate Nevada’s Wild Horses
They couldn’t get their resolution through the state legislature so now they’re pleading with the federal government, according to a report posted this morning by Nevada Current, an online service devoted to political and policy news and commentary.
The story includes the ridiculous quote about climate change by the chief scientist of HSUS, one of the signatories to the rancher-friendly ‘Path Forward.’
Do not be misled by statements from representatives of the Campaign Against America’s Wild Horses. The group offers no meaningful opposition to land-use plans that shift most of the resources in HMAs to privately owned livestock.
They oppose helicopter roundups but spend untold amounts to get rid of wild horses with PZP, appeasing the government bureaucrats and helping them enforce the lopsided allocations of those plans. They are not signatories in fact but signatories in principle.
Approximately 65% of the public acres in Nevada grazing allotments managed by the BLM fall into the Improve category, according to data from March, 2021.
RELATED: SJR3 Grifter Lectures Us on Wild Horses and Public Lands.
Mustang Monday
At the Currituck Outer Banks with Andrew Knepper.
Surprise Complex Roundup Day 5
The incident began on September 28. Gather stats through October 2:
- Type: Planned
- Method: Helicopter
- Horses captured: 441, up from 307 on Day 3
- Average daily take: 88.2
- Capture goal: 1,220
- Removal goal: 1,050
- Returned: 15
- Deaths: 7, up from 6 on Day 3
- Shipped: 281, up from 155 on Day 3
An orphan colt died on Day 4. The death rate is now 1.6%.
The breakdowns between stallions, mares and foals were not provided.
Body condition scores are not known.
Operations will move to High Rock and Wall Canyon tomorrow. Six HMAs are involved in the roundup.

Day 5 ended with 138 unaccounted-for animals.
Other statistics:
- AML: 496
- Forage assigned to horses: 5,952 AUMs per year
- Pre-gather population: 1,300
- Forage liberated to date: 5,112 AUMs per year
- Water liberated to date: 4,260 gallons per day
- Forage assigned to livestock: Unknown
- Horses displaced from Complex by livestock: Unknown
- True AML: Unknown
RELATED: Surprise Complex Roundup Day 3.
TCF Hosts Webinar on Wild Horses and Media
The 75-minute panel discussion features Vickery Eckhoff and Cynthia Smoot.
If you’re going to the Rock Springs roundup next week, bring Tables 1 and 8 from the Final EA and maybe a copy of this post.
Unabashed and Unapologetic, ASPCA Pushes Fertility Control
The government has already assigned most of the resources to privately owned cattle and sheep.
What’s the best way to make sure those specifications are fulfilled?
Safe and humane fertility control, according to a news release issued yesterday.
The ‘Path Forward‘ signatory, like other advocacy groups, has decided that the best way to protect wild horses is to get rid of them, just what the ranchers ordered.
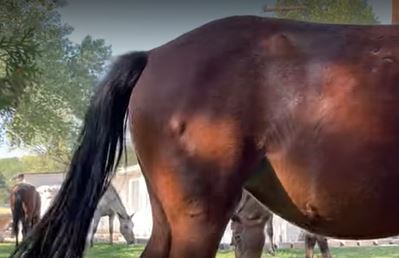
In practice, because the ranchers want their allocated share of the forage now and are unwilling to wait for the herds to die off as birth rates sink to zero, helicopters will do most of the dirty work, with the advocates in a mopping up role, stalking the mares with their darting rifles and shooting them with PZP, ensuring that the herds don’t try to reclaim any of their food from the most noble and deserving non-native species on America’s public lands.
Mission accomplished.
RELATED: Unabashed and Unapologetic, DeMayo Pushes ‘Path Forward.’

Beatys Butte Roundup Day 26
The incident began on September 6. Gather stats through October 1:
- Type: Planned
- Method: Bait
- Horses captured: 22
- Average daily take: 0.8
- Capture goal: 100
- Removal goal: 50
- Returned: 0
- Deaths: 1
- Shipped: 21
Activity has been sporadic and reports, when they appear, cover several days.
A stallion died of injuries related to the roundup during the third period (September 27 to October 1). The death rate is 4.5%.
The breakdowns between stallions, mares and foals were not provided.
Body condition scores are not known.
Day 26 ended with no unaccounted-for animals.
Other statistics:
- AML: 250
- Forage assigned to horses: 3,000 AUMs per year
- Pre-gather population: 261
- Forage liberated to date: 264 AUMs per year
- Water liberated to date: 220 gallons per day
- Forage assigned to livestock: 19,000 AUMs per year (estimated)
- Horses displaced from HMA by livestock: 1,583 (3.2% of off-range holding)
- True AML: 1,833
RELATED: Beatys Butte Roundup Underway.
Jackson Mountains Roundup and Killing Spree Over
The incident ended today with 527 horses captured, 495 shipped, 31 dead and one returned, according to figures at the gather page.
The removal goal was 600. All animals were accounted for.
Foals represented 22.0% of the horses captured. Of the adults, 40.4% were stallions and 59.6% were mares, an assignably large gap between males and females.
The death rate was 5.9%.
A foal was put down on Day 4 because it was orphaned. Today, the gather page says it was euthanized because of malnutrition. Eighteen other such cases were reported.
The news release, issued today, says the BLM gathered and removed 527 wild horses.
RELATED: Jackson Mountains Emergency Roundup Starts Next Week.
BLM Gaslighting American Public About Wild Horses?
You can call it whatever you want—lying would work—but the goal is to make sure that privately owned livestock are the leading consumers of resources on America’s public lands, even in areas set aside for wild horses, as noted in a column published yesterday by The Salt Lake Tribune.
They’re not alone in the effort.
The overpopulation narrative is also pushed by the advocates, to justify their ruinous darting programs, and the cheerleader groups for the ranchers:
- Stock grower’s associations and farm bureaus
- Departments of agriculture and wildlife
- Rangeland resource commissions
- Public lands councils
- Advisory boards
Surprise Complex Roundup Day 3
The incident began on September 28. Gather stats through September 30:
- Type: Planned
- Method: Helicopter
- Horses captured: 307
- Average daily take: 102.3
- Capture goal: 1,220
- Removal goal: 1,050
- Returned: 15
- Deaths: 6
- Shipped: 155
Two horses died during the first three days and four were put down due to pre-existing conditions, yielding a death rate of 2.0%.
The daily breakdowns between stallions, mares and foals were not provided.
Body condition scores are not known.
Fifteen stallions were released on Day 3.
Six HMAs are involved in the roundup.
Day 3 ended with 131 unaccounted-for animals.
Other statistics:
- AML: 496
- Forage assigned to horses: 5,952 AUMs per year
- Pre-gather population: 1,300
- Forage liberated to date: 3,504 AUMs per year
- Water liberated to date: 2,920 gallons per day
- Forage assigned to livestock: Unknown
- Horses displaced from Complex by livestock: Unknown
- True AML: Unknown
RELATED: Roundup in Progress at Surprise Complex.
Devil’s Garden Roundup Day 14
The incident began on September 16. Reports covering activity through September 29 have been posted to the Modoc news page:
- Type: Planned
- Method: Helicopter
- Horses captured: 229, up from 173 on Day 12
- Average daily take: 16.4
- Capture goal: 600
- Removal goal: 600
- Returned: 1
- Deaths: Unknown
- Shipped: Unknown
Foals represented 12.7% of the horses captured. Of the adults, 50.5% were males and 49.5% were female.
The number of deaths and number of animals shipped have not been reported.
Body condition scores were not provided.
The number of unaccounted-for animals cannot be determined.
Other statistics:
- AML: 402
- Forage assigned to horses: 4,824 AUMs per year
- Pre-gather population: 1,926
- Forage liberated to date: 2,736 AUMs per year
- Water liberated to date:2,280 gallons per day
- Forage assigned to livestock: 15,711 AUMs per year (estimated)
- Horses displaced from WHT by livestock: 1,309 (2.6% of off-range holding)
- True AML: 1,711
RELATED: Devil’s Garden Roundup Day 12.
Draft EA for Spring Mountains Complex Out for Review
Yesterday marked the beginning of a 30-day comment period on a new environmental assessment for wild horse and burro management in the Spring Mountains Complex, west of Las Vegas, NV.
The Complex includes lands managed by the USFS and BLM, and consists of three Joint Management Areas, according to a BLM news release. Map 1 in Appendix A of the EA shows the arrangement.
The Proposed Action would implement a Herd Management Area Plan that affirms the AMLs for the Red Rock and Spring Mountains / Wheeler Pass JMAs and increases the AML for the Johnnie JMA. The current AMLs are shown in Table 1 of the EA, with the proposed AMLs in Table 3.
The Proposed Action features removal of excess animals, fertility control vaccines, surgical sterilization and sex ratio skewing.
The Complex consists of 784,326 acres of public lands, with 164,856 acres (21%) managed by the Forest Service and 619,470 acres (79%) controlled by the BLM.
The three JMAs, Red Rock, Johnnie and Spring Mountains / Wheeler Pass, cover 187,639 acres, 216,874 acres and 379,813 acres, respectively.
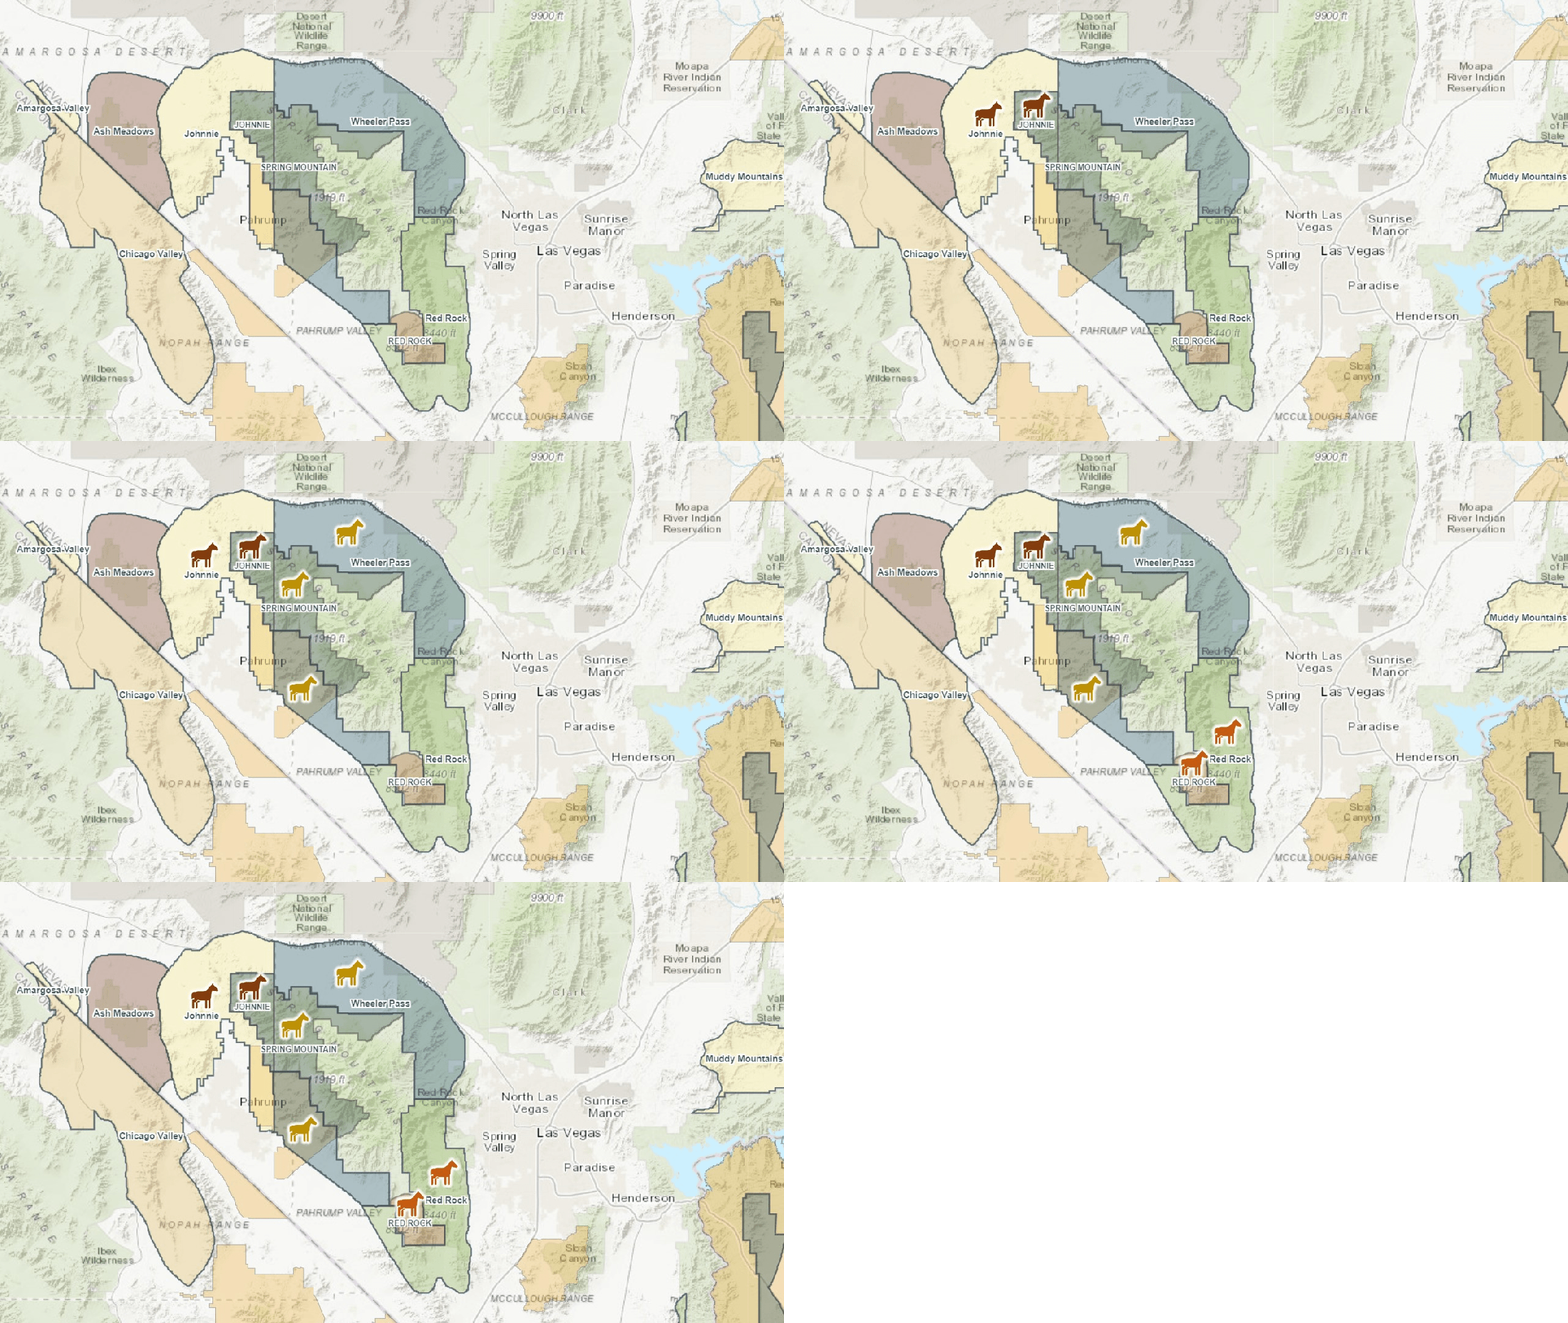
The combined AMLs under the Proposed Action are 127 horses and 192 burros, with a total forage demand of 2,676 AUMs per year. Table 3 yields 2,670 AUMs per year.
The proposed AMLs are equivalent to 223 wild horses, for an aimed-at stocking rate of 0.3 wild horses per thousand acres. The average rate across all HMAs is one wild horse per thousand acres.
The Complex includes one grazing allotment, Wheeler Wash, according to the Western Watersheds map, with no active AUMs.
Comments will be accepted until October 29.
The EA was posted with other project documents at the Forest Service NEPA site.
Jackson Mountains Roundup Day 14, Killing Fields Edition
The incident began on September 15. Gather stats through September 28:
- Type: Emergency
- Method: Helicopter
- Horses captured: 488, up from 392 on Day 12
- Average daily take: 34.9
- Capture goal: 600
- Removal goal: 600
- Returned: 1, no change from Day 12
- Deaths: 26, up from 18 on Day 12
- Shipped: 390, up from 320 on Day 12
Four horses were put down on Day 13, followed by four more on Day 14, because they were malnourished. The death rate is now 5.3%, up from 4.6% on Day 12.
All eight deaths were justified by IM 2021-007, Euthanasia of Wild Horses and Burros Related to Acts of Mercy, Health or Safety.
If they were on private property, they’d likely be confiscated by the sheriff and placed with a local rescue. Not these, they are federally protected.
Foals represented 22.1% of the horses gathered. Of the adults, 40.3% were stallions and 59.7% were mares, an assignably large gap between males and females.
Body condition scores were not provided.
Day 14 ended with 71 unaccounted-for animals.
Other statistics:
- AML: 217
- Forage assigned to horses: 2,604 AUMs per year
- Pre-gather population: 1,018
- Forage liberated to date: 5,844 AUMs per year
- Water liberated to date: 4,870 gallons per day
- Forage assigned to livestock: 7,394 AUMs per year (estimated)
- Horses displaced from HMA by livestock: 616 (1.2% of off-range holding)
- True AML: 833
RELATED: Jackson Mountains Roundup Day 12, Killing Fields Edition.
Rock Springs Off-Range Corrals Closed to Public
Tours and adoptions have been temporarily suspended in support of upcoming gather operations in the Rock Springs HMAs, according to a report in today’s edition of the Rocket Miner, a news service of the Wyoming Tribune Eagle.
RELATED: Rock Springs Roundup Starts in Two Weeks.
How Many Allotments Overlap Onaqui Mountain HMA?
The comment report for resource enforcement actions shows ten but the map by Western Watersheds shows twelve.
The HMA has been parted out for livestock grazing.
The doctrine of multiple use is a ruse. It’s actually predominant use or principal use, for ranching interests.
Those who say there’s nothing we can do about it or we need to control their numbers with PZP are allies of the ranchers not the horses. They are already whipped.

Devil’s Garden Roundup Day 12
The incident began on September 16. Reports covering activity through September 27 have been posted to the Modoc news page:
- Type: Planned
- Method: Helicopter
- Horses captured: 173, up from 100 on Day 6
- Average daily take: 14.4
- Capture goal: 600
- Removal goal: 600
- Returned: 1, on Day 8
- Deaths: Unknown
- Shipped: Unknown
Gather activity did not occur yesterday due to weather. One horse escaped from the traps on Day 8.
The daily reports are almost useless. The number of deaths, cause of death and the number of animals shipped have not been provided.
The breakdown between stallions, mares and foals was not given for Days 9, 10 and 11.
On other days those figures had to be calculated from the cumulative totals.
Body condition scores were not provided.
The number of unaccounted-for animals cannot be determined.
Other statistics:
- AML: 402
- Forage assigned to horses: 4,824 AUMs per year
- Pre-gather population: 1,926
- Forage liberated to date: 2,064 AUMs per year
- Water liberated to date: 1,720 gallons per day
- Forage assigned to livestock: 15,711 AUMs per year (estimated)
- Horses displaced from WHT by livestock: 1,309 (2.6% of off-range holding)
- True AML: 1,711
RELATED: Devil’s Garden Roundup Day 6.
Roundup in Progress at Surprise Complex
The gather page was created today but no data were given.
RELATED: Roundup Starts Next Week at Surprise Complex.
UPDATE: Day 1 ended with 142 horses captured, two deaths and none shipped.

