The Paisley Desert HMA covers 297,802 acres in central Oregon and has an AML of 150, according to a 2009 Environmental Assessment for wild horse management actions over a ten year period.
Western Horse Watchers was unable to find a current assessment and record of decision in the NEPA register, which may explain why the roundup last month was carried out on an emergency basis. The appendices and maps were not provided with the old EA and ROD.
The horses allowed by plan require 1,800 AUMs per. The stocking rate allowed by plan is 0.5 horses per thousand acres.
The HMA intersects four allotments. The map packet in the 2003 Lakeview RMP shows them, along with many others, but does not show the HMA boundary. A rough outline has been added by Western Horse Watchers, suggesting that all of the land inside the HMA is subject to permitted livestock grazing.

Table 1 in the EA provides grazing seasons and forage allocations inside the HMA.
The management plan assigns 10,151 AUMs per year to livestock, 1,800 AUMs per year to horses and 624 AUMs per year to wildlife.

The Christmas Lake grazing season is 9.5 months per year. The CL permittee would have to place 484 cow/calf pairs inside the HMA to graze off 4,598 AUMs in that time frame. The estimated herd sizes for the other three allotments are 882, 300 and 238 cow/calf pairs, respectively, for a total of 1,904 cow/calf pairs inside the HMA.
The estimated stocking rate is 1,904 ÷ 297,802 × 1,000 = 6.4 cow/calf pairs per thousand acres and the weighted average grazing season is 5.3 months per year.
These figures are compared in the following charts.
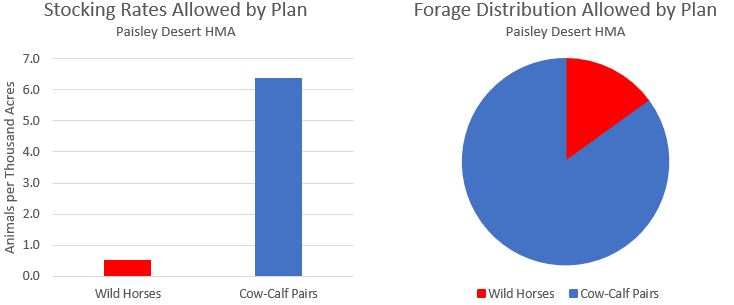 The HMA is managed primarily for livestock. Wild horses receive just 15% of the total authorized forage, excluding wildlife, providing more evidence that fractional stocking rates correlate with large amounts of forage diverted to privately owned livestock.
The forage assigned to livestock would support an additional 846 horses, for a true AML of 996.
The 350 horses remaining after the roundup put the HMA at 0.4X AML, not 2.3X AML.
The pre-gather population of 1,050 contained 54 excess horses, not 900.
If livestock aren’t free to move from one allotment to another, how are the horses supposed to do that? The map above only shows the allotment boundaries, it does not show the pastures within the allotments. The place must be crawling with fences.
RELATED: Paisley Desert Preview.
