Earlier this week the BLM said that some of the wild horses at Saylor Creek HMA would be removed because there are too many of them. Let’s take a look at the numbers.
The HMA covers 101,858 acres in southern Idaho. The AML is 50, yielding an aimed-at population density of 0.5 wild horses per thousand acres (50 ÷ 101,858 × 1,000).
The 50 horses allowed by plan would consume 600 AUMs annually, given they graze 12 months per year (50 × 12).
The 137 horses currently on the HMA consume 1,644 AUMs per year (137 × 12).
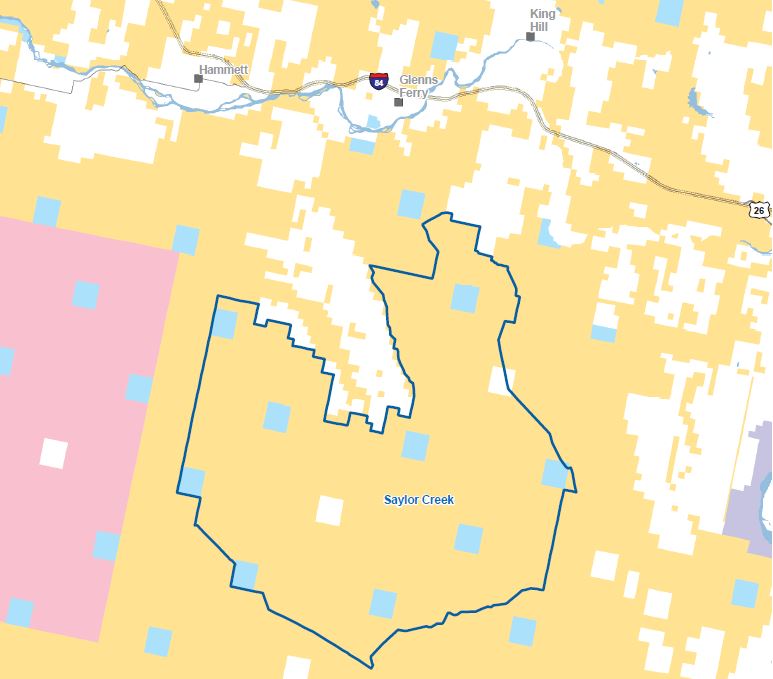
The HMA intersects eight grazing allotments, see Map 1 in the Final Environmental Assessment for the roundup (page 36)*. Some allotments are 100% inside the HMA, others overlap partially. None of the HMA is livestock-free.
Table 2 in Section 3.3 of the EA shows the grazing season and permitted AUMs for each allotment (page 17).
The allotments contribute forage to livestock according to their percentage in the HMA, assuming the resource is evenly distributed across the parcels. For example, Black Mesa provides 785 AUMs per year because 78% of the land is inside the HMA (1,007 × .78).
The total forage allowed by plan for livestock inside the HMA is 11,193 AUMs per year, compared to 600 AUMs per year for wild horses.
The forage contributions can be converted to cow/calf pairs by dividing them by the number of months in their grazing seasons. (Wild horses are said to be equivalent to cow/calf pairs in terms of their forage demand.)
The grazing season for Dove Springs is 8.5 months. It is 100% inside the HMA, with 1,360 AUMs per year allowed by plan, yielding, 1,360 × 1 ÷ 8.5 = 160 cow/calf pairs in the HMA.
The total number of cow/calf pairs allowed in the HMA is 1,321, compared to 50 horses.

The average grazing season across the eight allotments is 8.5 months (11,193 ÷ 1,321).
The aimed-at population density for livestock inside the HMA is 1,321 ÷ 101,858 × 1,000 = 13 cow/calf pairs per thousand acres, compared to 0.5 wild horses per thousand acres.
These figures are displayed in the following charts.

The roundup will come very close to achieving these goals.
Six of the allotments have been granted temporary increases in forage consumption, indicated as TNR AUMs in Table 2. If those figures had been used in the calculations, the disparity between horses and cattle would be even greater.
Clearly, the land can support way more than 50 wild horses. But the truth is masked by the deceit and greed of the public-lands ranchers and their allies in government.
*If you can’t view the map, click here. BLM is aware of the problem. If you can’t access the EA, click here.
