Would you buy a five bedroom home if you could only use one bedroom?
Welcome to the wild horse world.

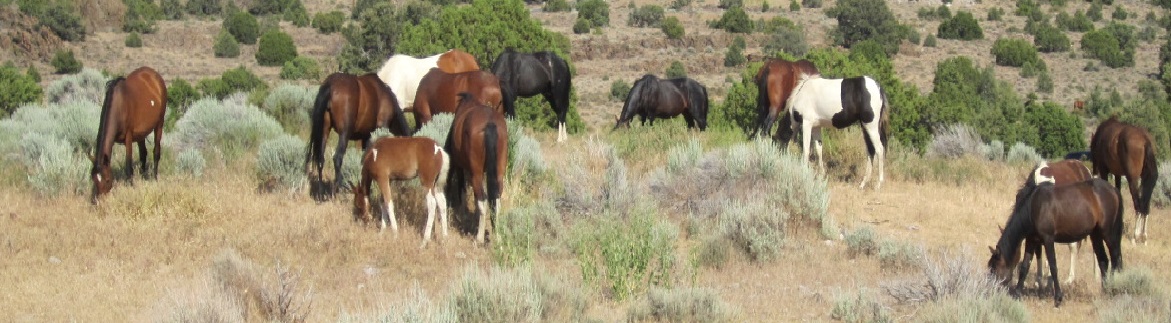
Western Horse Watchers Association
Exposing the Hypocrisy, Lies and Incompetence of the Wild Horse Advocates
On the range
Would you buy a five bedroom home if you could only use one bedroom?
Welcome to the wild horse world.
The incident began on January 6. Gather stats through January 22:
One death was reported on Day 16, the result of a pre-existing condition.
Only one foal has been caught to date. Roughly 44% of captured adults are male and 56% are female. Some of the mares are probably within a few weeks of foaling.
Body condition scores are not known.
The HMA of origin was not reported. Three HMAs are involved in the roundup.
The number of unaccounted-for animals is 91.
Some of the mares are to be treated with contraceptives and returned to the range but no such activity has been reported.
RELATED: Eagle Roundup Day 15.
One of new members of the WHBAB, a public-lands rancher, doesn’t think you should be able to participate in the permit renewal process or other projects involving public lands—your lands. Go to 14:26 in this video.
RELATED: BLM Fills WHBAB Vacancies.
Follow-up to last week’s report about wild horses grazing in the Calvada Eye, courtesy of KPVM News of Pahrump, NV.
RELATED: Pahrump Wild Horses Share Park with Residents.
Refer to this opinion piece, published today by the Record-Courier of Gardnerville, NV.
The viewpoints expressed in the column are those of its author and not necessarily those of Western Horse Watchers.
RELATED: Coming Soon: WHB Act at 50.
The start of incident was not announced at the BLM news page but the gather page says it began on January 12. Go to the Colorado Gathers and Removals page and click the plus sign (+) for Sand Wash Basin to see the daily reports.
Ten horses had been captured through January 16.
RELATED: BLM Confirms Sand Wash Gather.
The incident began on January 6. Gather stats through January 20:
No horses were captured on Day 14. No deaths were reported on Days 14 and 15.
Only one foal has been caught to date. Roughly 43% of captured adults are male and 57% are female. Some of the mares are probably within a few weeks of foaling.
Body condition scores are not known.
The HMA of origin was not reported. Three HMAs are involved in the roundup.
The number of unaccounted-for animals is 43.
The number of mares that have been treated with contraceptives and returned to the range is not known.
RELATED: Eagle Roundup Day 13.
A report posted today by the Craig Press says the funds have been raised and the project has been given a green light by the Colorado Department of Transportation.
The fence, to be 3.5 feet tall, will be installed along Highway 318, keeping the horses off the roadway without restricting access to food and water.
Horses placed into private care from areas like this one must be corralled by six foot fences until gentled.
Table 1-1 in the Draft EA for resource enforcement actions at the Surprise Complex provides the sizes of the six HMAs involved. Table 1-2 provides the forage allocations and AMLs.
Table 3-2 provides the forage allocations and grazing seasons for the six allotments that overlap the HMAs. The allotment master report created on January 17 by RAS provides the allotment sizes and permittees.
The map in Appendix G shows how the HMAs and allotments are related.
What do these data tell you about the management priorities at the Complex?

Land in the Bare Allotment, which overlaps the Fox Hog HMA, can produce 65.7 AUMs per thousand acres per year if you’re talking about livestock, but can only produce 21.4 AUMs per thousand acres per year if you’re talking about wild horses.
The Bare permittee would have to place 1,473 cow/calf pairs on the allotment to graze off 13,260 AUMs in a nine month season, for a stocking rate of 7.3 cow/calf pairs per thousand acres, while the management plan allows only 1.8 wild horses per thousand acres in Fox Hog.
In general, the land can produce almost four times as much forage for privately owned livestock than it can for wild horses, and can support an overall stocking rate for cattle that’s nearly seven times higher than the stocking rate for wild horses.
The HMAs are a subset of the allotments, with approximately 73% of the allotment acreage falling within the HMAs. If forage is evenly distributed, that means the cattle receive an estimated 22,300 AUMs per year inside the HMAs, compared to 6,000 AUMs per year for the horses.
The forage assigned to livestock would support an additional 1,850 wild horses, for a true AML of 2,350.
The Complex is managed primarily for livestock. The HMAs, and the crumbs assigned thereto, are concessions of the grazing program.
The Complex is not overpopulated. There are no excess horses and there is no justification for a roundup or fertility control program. The resources consigned to the public-lands ranchers are more than enough to support the current herd, thought to be around 1,300 animals.
RELATED: Surprises at Surprise Complex.
A decision notice was issued in November, subject to a 45-day appeal period.
That process ended on January 4, according to a report posted today by the Central Oregonian, and the Forest Service has 45 days to review the objections.
The WHT is subject to permitted livestock grazing, as noted in the article.
A login is required to read the full story.
The incident began on January 6. Gather stats through January 18:
Two deaths were reported on Day 12 and one on Day 13, due to pre-existing conditions.
A foal was taken on Day 12, the only one to date. Roughly 43% of captured adults are male and 57% are female. Some of the mares are probably within a few weeks of foaling.
Body condition scores are not known.
The HMA of origin was not reported. Three HMAs are involved in the roundup.
The number of unaccounted-for animals is 137.
Some of the mares will be treated with contraceptives and released but the gather page shows no such activity.
RELATED: Eagle Roundup Day 10.
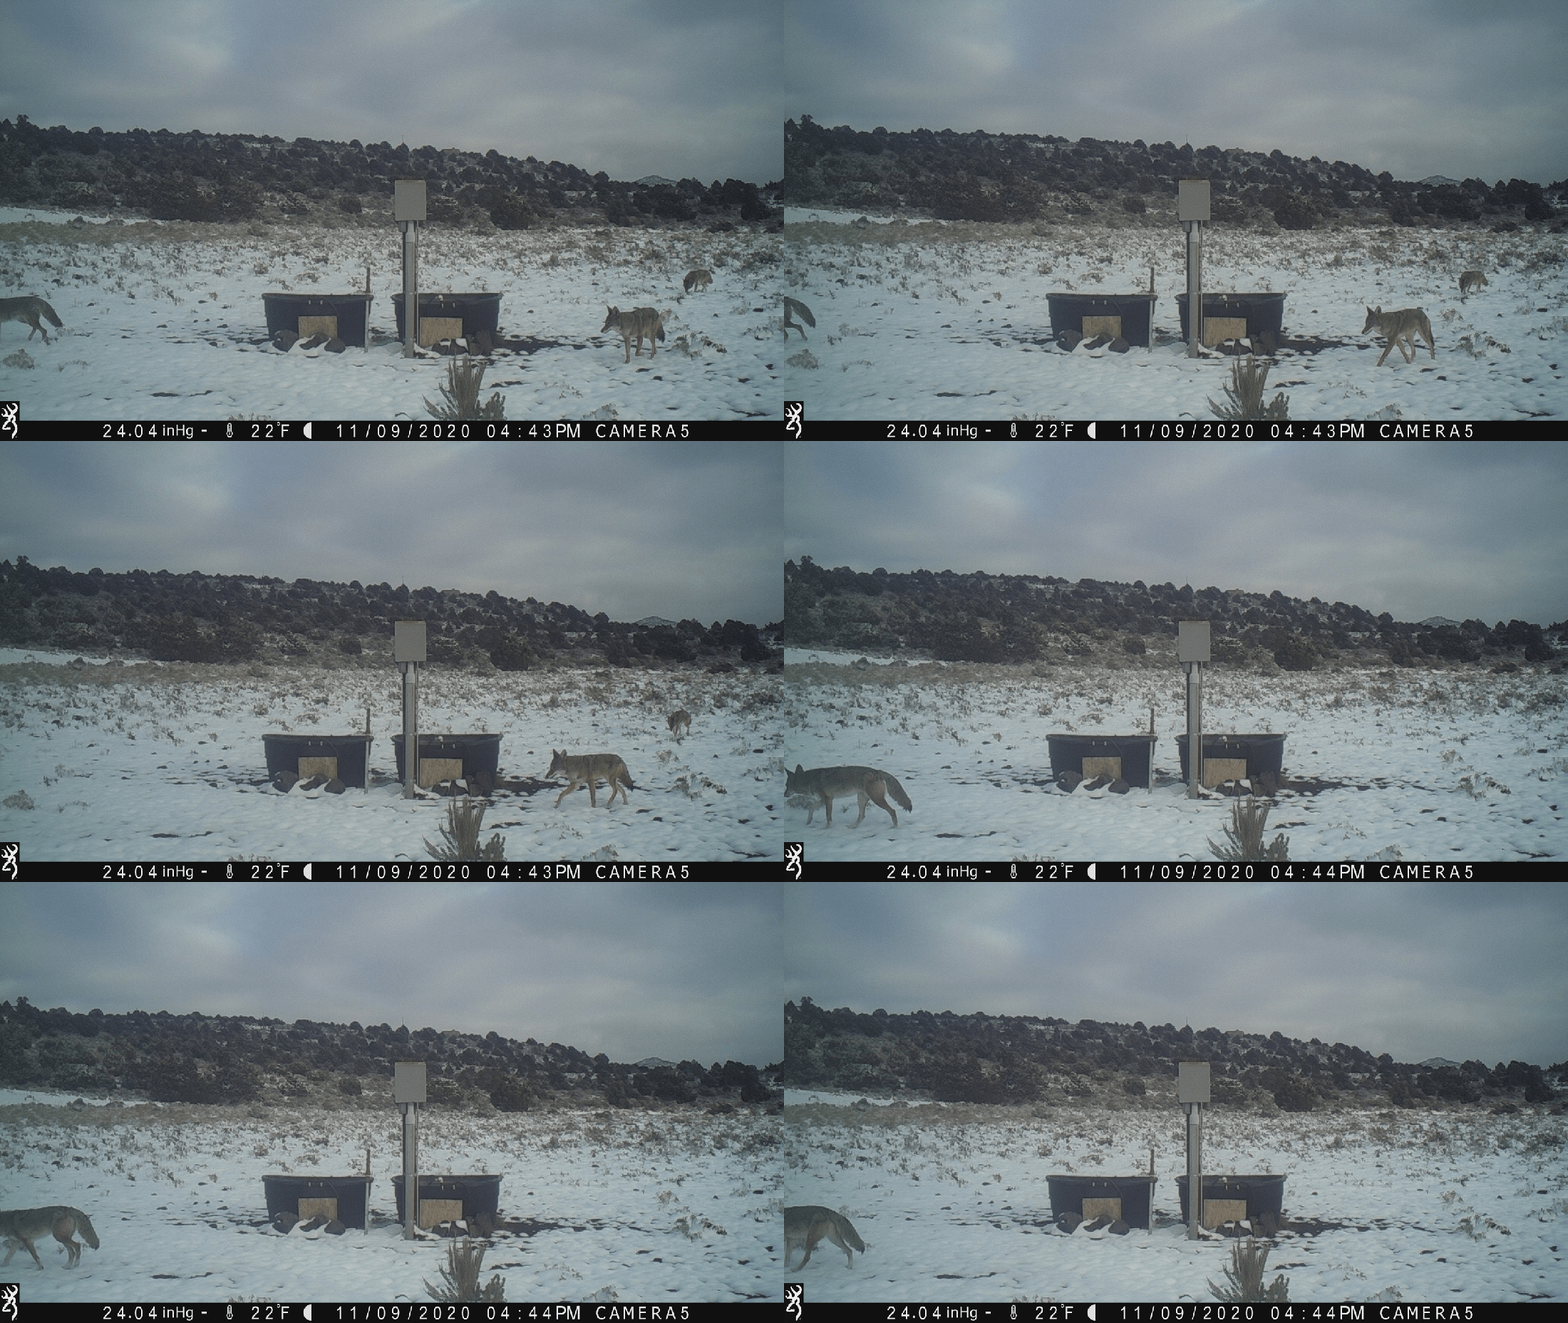
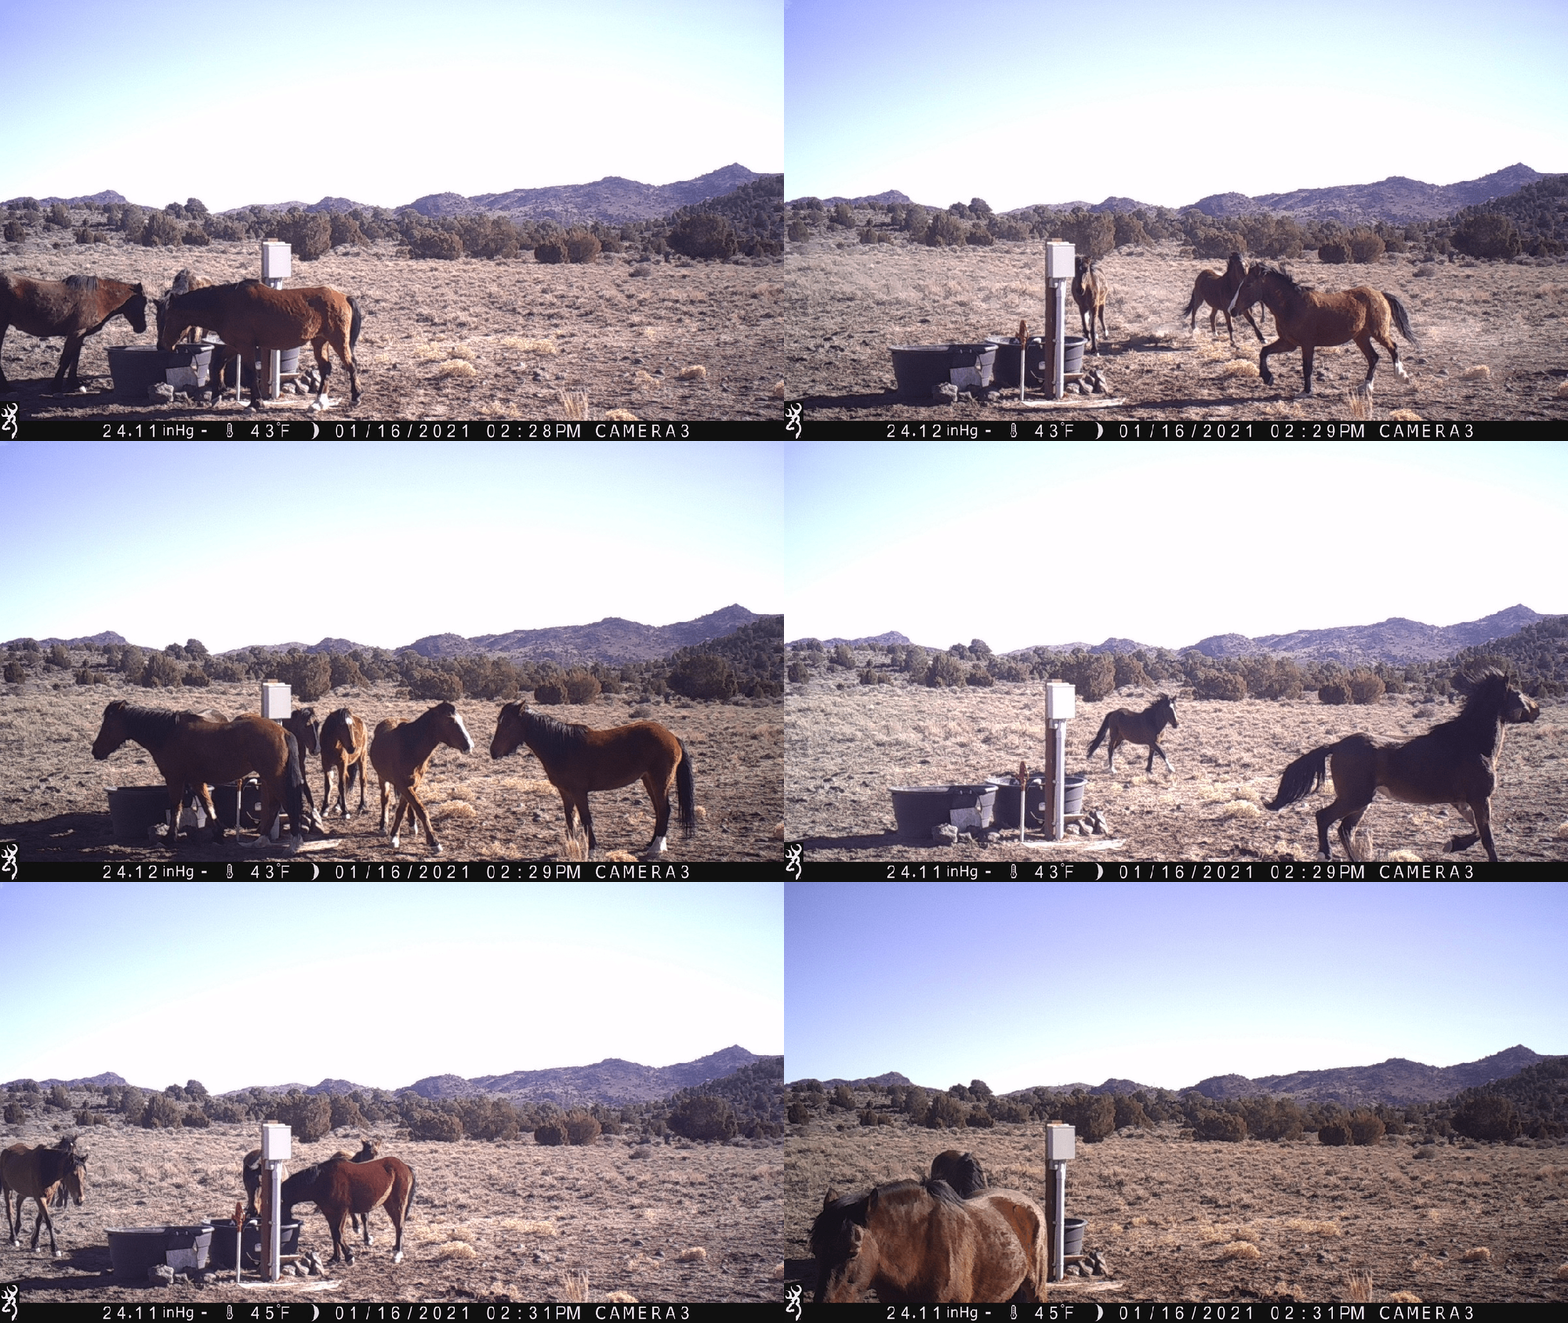
Catching up on trailcam photos. Water was shut off on November 6 but the tanks must be around half full, based on how far they’re leaning in to drink.

Refer to this guest column, appearing today in the Pagosa Daily Post.
It’s a bit technical and was written by the guy who wants America’s wild horses moved to remote wilderness areas, generally not suited for livestock grazing, so public-lands ranchers can have unfettered access to their food.
RELATED: Wild Horses Reduce Wildfires?
A bird’s eye view of the Placitas wild horses by Michael Junchaya.
If the Virginia Range was subject to permitted grazing, these guys would be gone.
RELATED: Missing Foal Update.
All six allotments in the Surprise Complex are in the Improve category, according to the Allotment Master Report in RAS. This may mean that they are not meeting one or more standards for rangeland health.
If so, how much of the shortfall can be attributed to wild horses and burros? Refer to Sections 1.6 and 3.2.4 in the Draft EA.
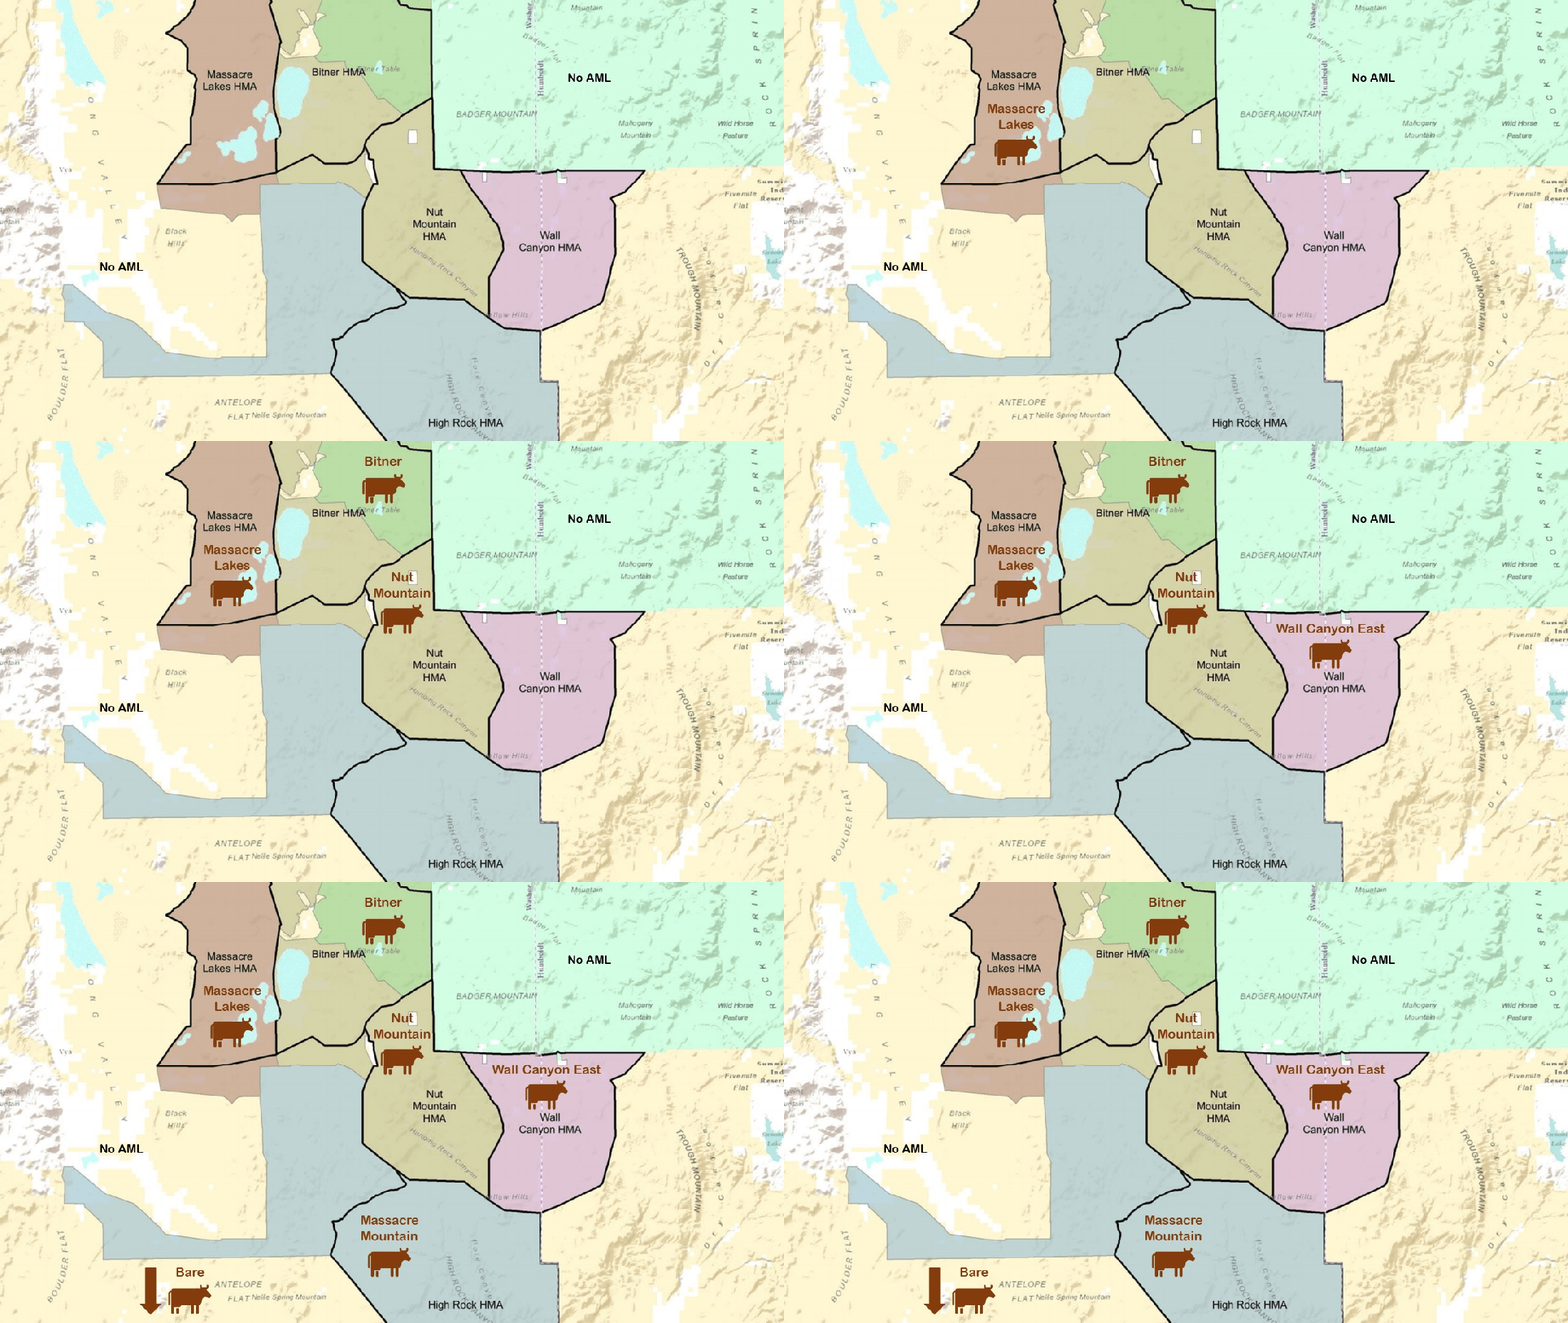
The Wall Canyon HMA coincides with the Wall Canyon East allotment, so it is a good candidate for a ‘Short End of Stick’ report.
The management plan assigns 300 AUMs per year to the horses (Table 1-2), compared to 3,215 AUMs per year to cattle (Table 3-2). That’s about 9% of the forage to horses and 91% to cattle, in an area set aside for the horses.
The proposed gather plan cannot change the resource allocations and management priorities in the Complex. It can only enforce them.
Was surprised to find the horses stopping by for water this time of year. System was shut off two months ago and tanks were empty. Reconnected hoses and filled them.
RELATED: Off for the Season.
The incident began on January 6. Gather stats through January 15:
No deaths were reported on Days 9 and 10.
No youngsters have been gathered. Roughly 44% of captured adults are males and 56% are females. Some of the mares are probably within a few weeks of foaling.
Body condition scores are not known.
The HMA of origin was not reported. Three HMAs are involved in the roundup.
The number of unaccounted-for animals is 118. They are probably being held on site.
Some of the mares will be treated with contraceptives and returned to the range.
RELATED: Eagle Roundup Day 8.
The Sacramento Bee put the opinion piece behind a paywall, which is good, given its authorship. Western Horse Watchers didn’t read it.
The PZP zealots will tell you that roundups are bad, while contraceptives are good, when neither can be justified. The problem is public-lands ranching.
Three new members, including a public-lands rancher, have been appointed to the Wild Horse and Burro Advisory Board, according to a news release issued today. Each will serve a three-year term on the nine-member Board.
RELATED: WHBAB Call for Nominations.

