Colville Gather Announced

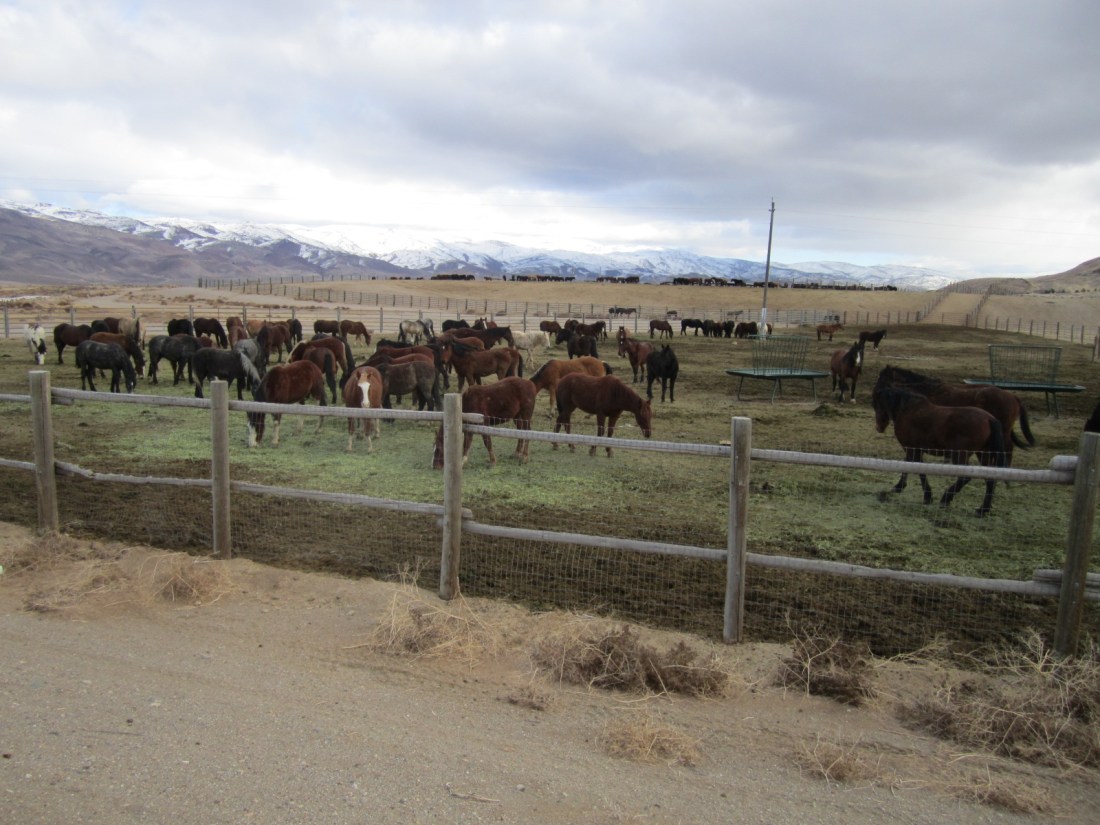
The Colville Tribes of northeastern Washington have issued an RFP to remove up to 1,500 wild horses from their reservation in the first quarter of 2019, according to a report that appeared yesterday in the Tribal Tribune of Nespelem, WA.

The goal of the roundup is to “…is to minimize the negative impacts of feral horses while maintaining a healthy and desirable population of approximately 50 to 200 of the highest quality, most desirable animals for use by the tribal membership.”

The report did not indicate if the gather would be open to public observation (probably not) and the disposition of captured horses.

Given that the area is only about 60 miles from the Canadian border, they may ship to slaughter, a common practice of their Yakama brothers to the south.

Silver King Update

Cumulative totals for the Silver King roundup, as of 12/06/18:

  • 625 animals gathered
  • 11 animal deaths
  • 0 animals returned to range

The pre-gather population density, per the original announcement, was 2.1 horses per thousand acres, about one fourth the population density of livestock in Nevada.

The post-gather population density of 0.4 animals per thousand acres means the HMA will almost be a horse-free zone, good news for the public-lands ranchers.

RELATED: Silver King Progress Report.

Livestock Grazing in Nevada

Data from the BLM rangeland grazing page and wild horse management page in Nevada:

  • 43 million acres available to livestock
  • 15.6 million acres available to horses and burros
  • 2 million AUMs available to livestock
  • 12,811 wild horses and burros allowed

Assuming that livestock graze six months per year, the AUM figure yields 333,000 cow/calf pairs on public lands in the state (2 million divided by 6).  The population density for these animals would be 7.7 cow/calf pairs per thousand acres (333,000 divided by 43 million times 1,000).

The population density for horses and burros is 0.8 animals per thousand acres (12,811 divided by 15.6 million times 1,000).

Land in Nevada can support ten times as many cow/calf pairs as horses and burros (7.7 divided by 0.8).  On HMAs subject to grazing allotments (which is most of them), it’s the same land!

Given that horses graze twelve months per year, they would consume roughly 154,000 AUMs annually (12,811 times 12).  If they were at 4X AML they would consume less than one third of the forage allocated to livestock (4 times 154,000 divided by 2 million).

Note that 4X AML represents almost two thirds of the wild horses and burros living on public lands managed by the BLM in the western U.S.  Earlier this year the total number of horses and burros was around 82,000 but is probably less than 70,000 now thanks to the roundups.

Two thirds of America’s wild horses and burros consume one third of the forage assigned to livestock in just one state, which supports an observation made earlier on these pages that the lion’s share of resources goes to cattle and sheep on western rangelands.  This is especially troubling on lands set aside for horses and burros.

Nevada_Livestock_Grazing-1

The Virginia Range, on the western side of the state, has a population density of ten animals per thousand acres, maybe a bit more, providing further evidence that HMAs with densities of two or three animals per thousand acres are far from overpopulated.

RELATED: Livestock Grazing in Wyoming.

Assemblyman Introduces Bill to ‘Protect’ Wild Horses in CA

Refer to this report, posted yesterday by the Times of San Diego.  Like most efforts in the wild horse world, it treats the symptoms but does not address the causes of declining wild horse populations on western rangelands, the greatest of which is public-lands ranching.

  • Too far downstream in the process
  • Focused on the outcomes
  • Guarantees more horses will be removed from the range

The director of a national ‘advocacy’ group praised the action, stating that horses should be regarded as “…partners, companions and icons of the American West who must be treated humanely [i.e., darted with PZP], not brutally butchered to supply foreign horsemeat markets.”

She’s fully on board with the overpopulation narrative, a bullshit storyline that draws attention away from the truth.

Robbing_Too_Much_Forage-1

RELATED: Public-Lands Ranching: How Bad Is It?, Stop the Roundups, Fertility Control is Better!

Livestock Grazing in Wyoming

Data from the BLM rangeland grazing page and wild horse management page in Wyoming:

  • 17 million acres available to livestock
  • 5 million acres available to horses (burros not reported)
  • 1.9 million AUMs available to livestock
  • 3,725 wild horses allowed

Assuming that livestock graze six months per year, the AUM figure yields 316,000 cow/calf pairs on public lands in the state (1.9 million divided by 6).  The population density for these animals would be 18.6 cow/calf pairs per thousand acres (316,000 divided by 17 million times 1,000).

The population density for horses is 0.7 animals per thousand acres (3,725 divided by 5 million times 1,000).

Land in Wyoming can support 26 times as many cow/calf pairs as horses (18.6 divided by 0.7).  In some cases, it’s the same land!

Given that horses graze twelve months per year, they would consume roughly 45,000 AUMs annually (3,725 times 12).  If they were at 4X AML they would consume less than ten percent of the forage allocated to livestock (4 times 45,000 divided by 1.9 million).

Wyoming_Livestock_Grazing-2

On hearing these results, the PZP zealots cried out “Hurry, we must dart those mares!”

RELATED: Livestock Grazing in Utah.

Livestock Grazing in Utah

Data from the BLM rangeland grazing page and wild horse management page in Utah:

  • 22 million acres available to livestock
  • 2.5 million acres available to horses and burros
  • 1.3 million AUMs available to livestock
  • 1,956 wild horses and burros allowed

Assuming that livestock graze six months per year, the AUM figure yields 216,000 cow/calf pairs on public lands in the state (1.3 million divided by 6).  The population density for these animals would be 9.8 cow/calf pairs per thousand acres (216,000 divided by 22 million times 1,000).

The population density for horses and burros is 0.8 animals per thousand acres (1,956 divided by 2.5 million times 1,000).

Land in Utah can support twelve times as many cow/calf pairs as horses and burros.  In some cases, it’s the same land!

Given that horses and burros graze twelve months per year, they would consume roughly 24,000 AUMs annually.  If they were at 4X AML they would consume less than one tenth of the forage allocated to livestock in the state.

Utah_Livestock_Grazing-1

Yet, the horses are overpopulated.  They have to go.  Livestock are blameless, always.

Pryor Mountains Adventures, Part 1

Hop in for a ride to the Pryor Mountains Wild Horse Range on the Montana-Wyoming border, one of only three areas in the western U. S. managed primarily for horses, not livestock.  Filmed in the summer of 2017.  Features the cabin visited by Ginger Kathrens in the Cloud documentary.  H/T Bigfoot Dad Explores Montana.

RELATED: Ride a Side-by-Side to See the Pryor Mountains Horses.

Wyoming HMA Stocking Rates

The chart below shows the stocking rate in animals per thousand acres as a function of land area for HMAs in Wyoming.  Stocking rates (population densities) are based on the upper values of the AMLs.

Three observations from the chart:

  • All stocking rates are less than three animals per thousand acres
  • Stocking rates are related to HMA size
  • Dispersion among stocking rates is greatest at the smaller HMAs

The largest stocking rate was found at Green Mountain HMA, 2.56.  The smallest rate corresponds to Little Colorado HMA, 0.16.

The correlation coefficient for HMA size and stocking rate is -0.53.  This statistic ranges in value from -1 to +1.  The closer the result to -1 or +1, the stronger the relationship between the two variables, in this case HMA size and stocking rate.

Wyoming_HMA_Population_Density-1

Note that the larger stocking rates are found at the smaller HMAs, while the smaller stocking rates occur at the larger HMAs, confirming the negative sign on the correlation coefficient.  A ‘shotgun’ pattern on the chart would have a correlation coefficient near zero, indicating no relationship between the two variables.

RELATED: Wyoming HMA Population.

Silver King Progress Report

Helicopters started flying on 11/27/18.  Results through 11/29/18:

  • Horses gathered 185
  • Horse deaths 2
  • Horses returned to range 0

The wild horse population was approximately ten times AML at the beginning of the roundup, which affected ‘other mandated uses’ of the land.

Robbing_Too_Much_Forage-1

See also this story posted today by The Ely Times.

When the gather is complete, the horses will be at 2X AML, consuming maybe twenty percent of the AUMs on the HMA.  Livestock will receive the rest.  If people understood this, the overpopulation narrative would fall to the ground, taking the fertility control programs with it.

RELATED: Another Unbalanced Report on Silver King Roundup.

Wyoming HMA Population

The following chart shows the population target (AML) for HMAs in Wyoming as a function of HMA size.  Accordingly,

  • Most of the HMAs contain 500,000 acres or less
  • Most of the AMLs are 400 or less
  • AMLs are loosely correlated with HMA size

The correlation coefficient for population and acreage is .46, which means the variations in HMA size are somewhat useful in explaining the variations in AMLs.  The closer the value of this statistic to 1, the stronger the relationship between population and acreage.

Wyoming_HMA_Population-1

If the correlation coefficient was 1, all of the data would fall on a straight line, indicating that population was proportional to acreage.  HMAs of 200,000 acres would have twice as many horses as HMAs of 100,000 acres.

Note that the largest HMA does not have the largest AML and the smallest HMA does not have the smallest AML, but, in general, population goes up as acreage goes up.

Dispersion among the AMLs on the left side of the chart (smaller HMAs) is less than the dispersion among the AMLs on the right side of the chart (larger HMAs), a problem in statistical work known as ‘non-constant variance.’

RELATED: Wyoming HMA Stats.