At the Salt River with Michael Pebbles.
Foals available for an additional charge (to drive to another area that hasn’t been ruined by the advocates).
Western Horse Watchers Association
Exposing the Hypocrisy, Lies and Incompetence of the Wild Horse Advocates
On the range
At the Salt River with Michael Pebbles.
Foals available for an additional charge (to drive to another area that hasn’t been ruined by the advocates).
No gather and removal activity for the past two days.
The holding pen was dismantled on Day 16 and moved to another location.
The number of unaccounted-for animals should have been zero when this occurred but the figures in the sidebar indicate two.
UAF Animals = 1,133 – 1,115 – 3 – 13 = 2
Refer to the Day 15 report for the latest results.
RELATED: East Pershing Roundup, Day 15.
The incident started on January 9. Results through January 13:
The figures above are based on the daily reports.
The reports now include the number of jacks, jennies and foals going back to Day 1.
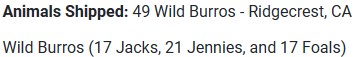
The shipping total for Day 3 should be 55, not 49, according to the breakdown.
Youngsters accounted for 13.0% of the animals gathered.
Of the adults, 53.4% were male and 46.6% were female.
The location of the trap site was not disclosed.
The HMA is subject to permitted grazing.
The National Data Viewer shows habitat loss and overlapping allotments. Click on map to open in new tab.
The management plan assigns 2.5 times more forage to livestock than the burros.
The roundup supports three tenets of rangeland management.
RELATED: Black Mountain Roundup, Day 3.

The roundup was set to begin on or about November 27.
The advocates say it isn’t necessary. To bolster their claim, they’ve been praying for
Their prayers may have been answered. As of today, no activity has been reported at the gather page.
RELATED: McCullough Update.
The incident started on January 9. Results through January 11:
The figures above are based on the daily reports.
Only the totals have been posted. The percentages of males, females and foals cannot be determined.
The HMA is subject to permitted grazing.
The National Data Viewer shows habitat loss and overlapping allotments. Click on map to open in new tab.
RELATED: Black Mountain Roundup Begins.
The incident began on December 28. Results through January 11:
The figures above are based on the daily reports, not the totals posted by the BLM.
Helicopters did not fly on Days 14 and 15.
A stallion was released on Day 15. No details were given.
Two stallions were dispatched on Day 15 due to leg injuries.
The death rate is 1.1%.
The capture total includes 480 stallions, 538 mares and 121 foals. The sidebar at the gather page says 532 mares captured.
Youngsters represented 10.6% of the animals gathered, consistent with a herd growth rate of five to six percent per year.
Of the adults, 47.2% were male and 52.8% were female, no evidence of an abnormal sex ratio.
The Complex is managed primarily for animal agriculture. The National Data Viewer shows habitat loss and grazing allotments. Click on image to open in new tab.
*According to advocates.

Day 15 ended with eight unaccounted-for animals.
There are no plans to treat any of the captured mares with fertility control pesticides and return them to the range.
Other statistics:
Overpopulation means more horses than allowed by plan, not necessarily more horses than the land can support.
The ability of the Complex to sustain wild horses has been limited by the bureaucrats, who have assigned most of their food to the public-lands ranchers.
Refer to these reports for an indication of the problem:
RELATED: East Pershing Roundup, Day 13.
In a news flash dated January 7, the Campaign Against America’s Wild Horses described the Virginia Range darting program as conservation.
Adjectives used in the blurb: Innocent, Majestic, Iconic.
Are they pandering to nitwits?
What will happen to the herd when the mares are sterile?
Why not classify motorized removal as conservation?
The darting program violates federal law but it’s not listed among their legal battles.
RELATED: Foal-Free Friday, Go Forth but Don’t Multiply Edition.
The reports for Days 1 and 2 provide totals only, no breakdowns for jacks, jennies and foals.
Questions about sex ratios and birth rates cannot be answered.
RELATED: Black Mountain Roundup Begins.
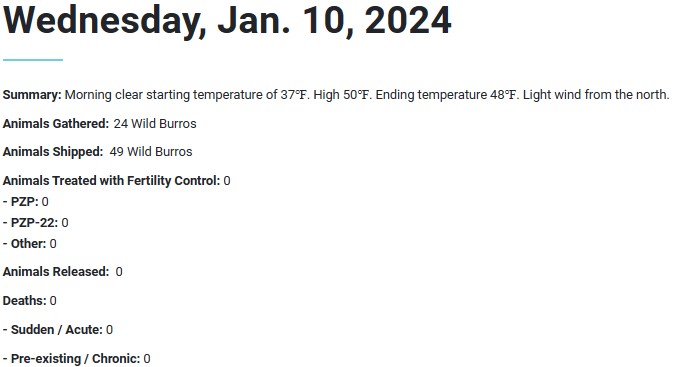
The incident started on January 9, with 80 burros captured, none shipped, none released and none dead.
The HMA covers 89,392 total acres, including 77,311 public acres, and the 100 burros allowed by plan receive 600 AUMs per year.
The stocking rate allowed by plan is 1.3 wild burros per thousand public acres.
Table 3.1 in the Final EA for pest control and resource enforcement indicates 34% of the Robbers Roost Allotment overlaps the HMA.
The National Data Viewer shows the arrangement. Click on image to open in new tab.
The allotment offers 3,840 active AUMs on 159,786 public acres.
Therefore, the bureaucrats have taken 3,840 × .34 = 1,305 AUMs per year from the burros and given them to the permittee, assuming the resource is evenly distributed across the parcel.
The number of burros displaced from the HMA by permitted grazing is 1,305 ÷ 6 = 217.
The True AML would be 100 + 217 = 317, the number of burros the HMA could sustain if it was managed principally for them as specified in the original statute.
Table 2.1 puts the current population at 168, about half of the carrying capacity.
The stocking rate at the new AML would be 317 ÷ 77,311 × 1,000 = 4.1 wild burros per thousand public acres, equivalent to two wild horses per thousand acres, to be achieved by confining the rancher to his base property in a year-round off season.
RELATED: BLM Publishes Canyonlands Final Planning Documents.

The Decision Record authorizes Alternative 1, the Proposed Action, with modifications, effective immediately for a ten-year period.
The Proposed Action, discussed in Section 2.2.1 of the Final EA, features gathers and removals of excess burros in and around the HMA, controlling population growth with PZP, GonaCon Equine or IUDs and possibly equipping burros with GPS tracking units.
The BLM will also collect samples to assess genetic diversity.
Animals from other areas could be introduced to the HMA, a tactic that boosts genetic diversity while keeping herd sizes small.
The decision limits the use of fertility control pesticides to a maximum of 10 jennies, after results from genetic testing have been received. IUDs will not be used at this time but could be considered in the future if an appropriately sized device is developed.
A roundup appears in the December 8 schedule with a start date of February 23.
The news release did not include a link to the project in ePlanning.
Approximately 70% of the HMA is subject to permitted grazing.
RELATED: Canyonlands EA Out for Review.
The incident began on December 28. Results through January 9:
The figures above are based on the daily reports, not the totals posted by the BLM.
The trap site was moved back to the North Stillwater HMA on Day 13.
Previously, trapping occurred in the Humboldt HA where 122 horses were caught, an area unfit for them, supposedly.
Two stallions were released (escaped?) on Day 13.
The death rate is 1.0%.
The capture total includes 480 stallions, 538 mares and 121 foals. The sidebar at the gather page says 532 mares captured.
Youngsters represented 10.6% of the animals gathered, consistent with a herd growth rate of five to six percent per year.
Of the adults, 47.2% were male and 52.8% were female, no evidence of an abnormal sex ratio.
Body condition scores ranged from 2.5 to 3.5 on Days 12 and 13.
The Complex is managed primarily for animal agriculture. The National Data Viewer shows habitat loss and grazing allotments. Click on image to open in new tab.
*According to advocates.
Day 13 ended with 201 unaccounted-for animals.
There are no plans to treat any of the captured mares with fertility control pesticides and return them to the range.
Other statistics:
Overpopulation means more horses than allowed by plan, not necessarily more horses than the land can support.
The ability of the Complex to sustain wild horses has been limited by the bureaucrats, who have assigned most of their food to the public-lands ranchers.
Refer to these reports for an indication of the problem:
RELATED: East Pershing Roundup, Day 11.
At the Ozark National Scenic Riverways with Emily Gauthier.
The incident began on December 28. Results through January 7:
The figures above are based on the daily reports, not the totals posted by the BLM.
The trap site was moved to the Humboldt HA on Day 11.
A stallion was dispatched on Day 10 due to blindness in one eye. A colt was put down due to injuries sustained in capture.
The death rate is 1.2%.
The capture total includes 408 stallions, 447 mares and 85 foals. The sidebar at the gather page says 441 mares captured.
Youngsters represented 9.0% of the animals gathered, consistent with a herd growth rate of four percent per year.
Of the adults, 47.7% were male and 52.3% were female, no evidence of an abnormal sex ratio.
Body condition scores ranged from 2.5 to 3.5 on Days 10 and 11.
The Complex is managed primarily for animal agriculture. The National Data Viewer shows habitat loss and grazing allotments. Click on image to open in new tab.
*According to advocates.
Day 11 ended with 88 unaccounted-for animals.
There are no plans to treat any of the captured mares with fertility control pesticides and return them to the range.
Other statistics:
Overpopulation means more horses than allowed by plan, not necessarily more horses than the land can support.
The ability of the Complex to sustain wild horses has been limited by the bureaucrats, who have assigned most of their food to the public-lands ranchers.
Refer to these reports for an indication of the problem:
RELATED: East Pershing Roundup, Day 9.
The incident began on December 28. Results through January 5:
The figures above are based on the daily reports, not the totals posted by the BLM.
Helicopters did not fly on Day 9. No explanation was given.
A stallion was dispatched on Day 8 due to a previous leg injury.
The death rate is 1.1%.
The capture total includes 363 stallions, 405 mares and 70 foals.
Youngsters represented 8.4% of the animals gathered, consistent with a herd growth rate of three percent per year.
Of the adults, 47.3% were male and 52.7% were female, no indication of an abnormal sex ratio.
Body condition scores ranged from 2 to 4 on Day 8.
The location of the trap site was not given.
The Complex is managed primarily for animal agriculture. The National Data Viewer shows habitat loss and grazing allotments. Click on image to open in new tab.
*According to advocates.
Day 9 ended with 26 unaccounted-for animals.
There are no plans to treat any of the captured mares with fertility control pesticides and return them to the range.
Other statistics:
Overpopulation means more horses than allowed by plan, not necessarily more horses than the land can support.
The ability of the Complex to sustain wild horses has been limited by the bureaucrats, who have assigned most of their food to the public-lands ranchers.
Refer to these reports for an indication of the problem:
RELATED: East Pershing Roundup, Day 7.
An article dated January 4 by SFGate says the Nevada Department of Agriculture is close to announcing a new program, headed by a to-be-announced new hire: a Virginia Range feral and estray horse program manager, who will oversee programs set by Director J.J. Goicoechea and his team.
WARNING: The story contains images of family bands with foals, which will be disturbing to most advocates.
The author claims the Virginia Range is part of the Sierra Nevada, which your host disputes.
The mustangs arrived later in the 1980s and 1990s, according to Goicoechea, who said there were no wild horses in the area in 1984 according to NDA records.
He may be referring to a declaration by the BLM that there were no unbranded and unclaimed horses eligible for protection under the WHB Act.
But that doesn’t mean the Virginia Range was a horse-free area. We know that horses were present because of Velma’s encounter in 1950.
Further, the declaration may have pertained only to public lands administered by the BLM, which represent a third or less of the total landmass.
The Virginia Range covers almost 300,000 acres, not 2,800 acres as stated in the report.
NDA already hired a VRE program manager.
As for population growth and horse-car collisions in Reno, how much of the problem can be attributed to liberal lunacy in California that’s driving people out?
Goicoechea, a large-animal vet and public-lands rancher, holds 158 active AUMs on the Newark Allotment in the Bristlecone Field Office.
His dad receives 6,681 AUMs per year on the same parcel, equivalent to 556 wild horses.
RELATED: What’s So Important about the Virginia Range?
The herd on the Maryland side of the island consisted of 14 bands and 79 horses according to the January 3 inventory, compared to 15 bands and 81 horses in December.
Two older stallions died of natural causes.
One small bachelor band and an unattached mom/baby pair were noted.
No new foals were reported.
Two mares(?) were listed as “presumed missing.”
The safe, proven and reversible darting program was shut off in 2016 but the herd has not rebounded.
Not included in the update:
The BLM WHB Handbook indicates the breeding population should exceed 50 animals to maintain an acceptable level of genetic diversity.
The herd likely has an abnormal sex ratio, with many more females than males, and this may explain why there are so few unattached stallions.
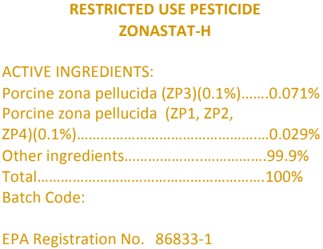
Western Horse Watchers believes the reports are intentionally vague because the herd has been ruined by Zonastat-H, a miracle drug according to the advocates.
The Assateague Island Alliance updates the lists.
RELATED: Assateague Pony Census, December 2023.
Augusta Mountains is one of three Herd Management Areas in the East Pershing Complex, now subject to the largest roundup of FY24.
The HMA covers 177,570 total acres, including 176,208 public acres, according to the 2023 HA/HMA Report. The figures for acreage at the HMA page are incorrect.
The 308 horses allowed by plan receive 3,696 AUMs per year.
The stocking rate allowed by plan is 1.7 wild horses per thousand acres, slightly higher than the target rate across all HMAs of one wild horse per thousand acres (27,000 animals on 27 million acres).
Table 8 in the Final EA for pest control and resource enforcement in the Complex shows four allotments that overlap the HMA.
The strategy for answering the question involves three more steps: (1) Determine the forage assigned to livestock inside the HMA, (2) Convert that number to wild horses and (3) Add the result to the current AML.
The Allotment Master Report at RAS provides acreage, management status and active AUMs.
Three allotments are managed by the Humboldt River Field Office and one is managed by the Mount Lewis Field Office so two reports were created (HRFO | MLFO).
The overlap percentage in Table 8 for Hole in the Wall is 100% but the National Data Viewer shows a small portion outside the HMA so 95% will be used in the calculations.
Table 8 indicates 100% of Cottonwood is inside the HMA but the NDV shows much of it outside, so 40% will be used.
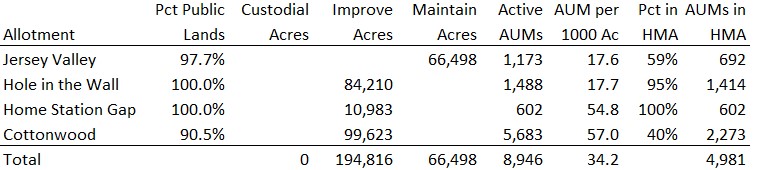
The bureaucrats have assigned an estimated 4,981 AUMs per year to livestock inside the HMA, equivalent to 415 wild horses. This is the number of horses displaced from the HMA by permitted grazing.
The True AML, the number of horses the HMA could support if it was managed principally for them as specified in the original statute, is 723.
The stocking rate at the new AML would be 4.1 wild horses per thousand public acres.
Hey Western Horse Watchers, is that a lot? The Virginia Range was carrying ten before the advocates got involved.
The BLM will collect 4,981 × 1.35 = $6,724.35 per year from ranching activity inside the HMA while it spends 415 × 5 × 365 = $757,375 per year to care for the horses displaced thereby.
Would you say that’s a wise use of the public lands?
The True AML can be achieved by confining the ranchers to their (multi-million dollar) base properties in a year-round off season.
RELATED: How Many Wild Horses Can the Tobin Range HMA Support?
The incident began on December 28. Results through January 3:
Helicopters did not fly on Day 7 due to snow.
The death rate is 1.1%.
The capture total includes 316 stallions, 360 mares and 57 foals.
Youngsters represented 7.8% of the animals gathered, consistent with a herd growth rate of two to three percent per year.
Of the adults, 46.7% were male and 53.3% were female, no evidence of an abnormal sex ratio.
Body condition scores averaged 3 on Day 6.
The location of the trap site was not given.
The Complex is managed primarily for animal agriculture. The National Data Viewer shows habitat loss and grazing allotments. Click on image to open in new tab.
*According to advocates.
Day 7 ended with 117 unaccounted-for animals.
There are no plans to treat any of the captured mares with fertility control pesticides and return them to the range.
Other statistics:
Overpopulation means more horses than allowed by plan, not necessarily more horses than the land can support.
The ability of the Complex to sustain wild horses has been severely limited by the bureaucrats, who have assigned most of their food to the public-lands ranchers.
RELATED: East Pershing Roundup, Day 5.
The Tobin Range HMA, one of three Herd Management Areas in the East Pershing Complex, covers 198,236 total acres, including 186,654 public acres.
The 42 horses allowed by plan receive 504 AUMs per year, or 2.7 AUMs per year per thousand public acres.
The stocking rate allowed by plan is 0.2 wild horses per thousand acres, compared to a target rate across all HMAs of one wild horse per thousand acres (27,000 animals on 27 million acres).
Why is it so low?
Table 8 in the Final EA for pest control and resource enforcement in the Complex shows five allotments that overlap the HMA.
The overlap percentages seem reasonable based on the arrangement in the National Data Viewer, except for Buffalo Valley. Western Horse Watchers believes the figure is closer to 15%, not 27%, so that amount will be used in the calculations.
The Allotment Master Report at RAS supplies acreage, management status and active AUMs.
Three of the allotments are managed by the Humboldt River Field Office and two are managed by the Mount Lewis Field Office, so two reports were created (HRFO | MLFO).

The allotments offer a weighted average 54.8 AUMs per year per thousand public acres, 20 times more than the land can produce for horses!
How is this possible?
The land-use plan has assigned most of the forage to livestock—in the lawful home of wild horses. Thus it is true that the horses have been cheated by the bureaucrats in favor of the ranchers with the cooperation of the advocates. (The advocates don’t like to talk about resource management. They want the ranchers to win.)
How many horses have been displaced from the HMA by permitted grazing?
Horses displaced = 11,187 ÷ 12 = 932
What’s the True AML?
True AML = 42 + 932 = 974
What’s the stocking rate at the new AML?
Stocking rate = 974 ÷ 186,654 × 1,000 = 5.2 horses per thousand public acres
The HMA is managed principally for livestock, with the horses receiving just 4.3% of the authorized forage, neglecting wildlife.
The BLM will collect 11,187 × 1.35 = $15,102.45 per year from ranching activity inside the HMA while it spends 932 × 5 × 365 = $1,700,900 per year to care for the horses displaced thereby.
Would you say that’s a wise use of the public lands?
The calculations above assume considerable dietary overlap between horses and livestock and uniform distribution of forage across the allotments.
RELATED: How Many Wild Horses Can the East Range HA Support?

