Report by ABC7 News of Los Angeles. All of the shootings have occurred in the Clark Mountain Herd Area on the north side of I-15 (see page 8 in the California HMA maps).
RELATED: Clark Mountain Reward Increases to $58K.
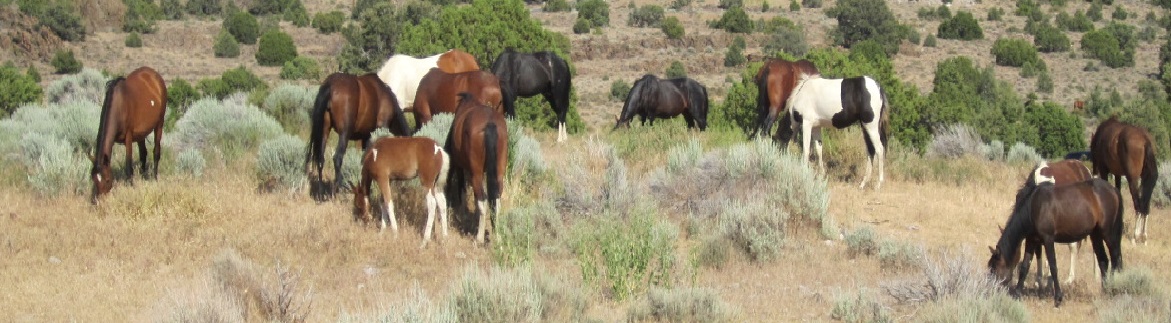
Western Horse Watchers Association
Exposing the Hypocrisy, Lies and Incompetence of the Wild Horse Advocates
Report by ABC7 News of Los Angeles. All of the shootings have occurred in the Clark Mountain Herd Area on the north side of I-15 (see page 8 in the California HMA maps).
RELATED: Clark Mountain Reward Increases to $58K.
Approximately 500 wild horses will be removed from the Devil’s Garden Plateau WHT, beginning September 5, according to an undated news release from the Forest Service.
The WHT covers 308,000 acres in northeastern California and has an AML of 402, for an aimed-at population density of 1.3 animals per thousand acres. The target density for WHB on public lands in the western U.S. is about one animal per thousand acres.

The gather will be open to public observation, with roughly 60% of the captured animals going to the Double Devil corrals in Alturas and 40% taken to the BLM off-range corrals in Litchfield.
The announcement said the roundup would support wild horse health by reducing competition for food and water but did not identify the leading contenders for those resources, namely, public-lands ranchers.
The WHT intersects eight grazing allotments, see map on page 80 of the environmental assessment. The roundup will liberate 6,000 AUMs per year, allowing greater forage utilization by livestock operators—on land set aside for the horses. The action will not increase permitted AUMs on those allotments.
A link to the gather stats and daily reports was not provided.
RELATED: Double Devil Corrals Emptied.
BLM said today that additional groups have pledged their support, bringing the reward for information leading to the arrest and conviction of those responsible for the deaths of 42 wild burros to $58,000. The events occurred along I-15 near the CA-NV border.
Each count carries a penalty of one year in prison and a $2,000 fine, according to the news release. The announcement did not indicate if any of the shootings took place on permitted grazing allotments.
BLM said today that approximately 600 excess wild horses would be removed from the Fish Creek HMA in central Nevada beginning September 6, with fifty to be returned.
Mares released back to the HMA will be treated with contraceptives, according to the news release.
The HMA covers 252,771 acres and has an AML of 180, for an aimed-at population density of 0.7 horses per thousand acres. The average density for all HMAs is one animal per thousand acres.

The operation will be open to public observation and captured animals will be taken to the Palomino Valley off-range corrals, twenty miles north of Sparks, NV.
The announcement said the roundup will reduce wild horse overpopulation and prevent rangeland degradation by balancing the herd size, but did not say what’s on the other side of the scales.
The HMA intersects four grazing allotments (see map on page four of the environmental assessment along with section 3.3 beginning on page 66).
The roundup will liberate 6,600 AUMs per year, allowing higher utilization rates by privately owned livestock…on land set aside for the horses. (The action will not increase permitted AUMs on those allotments.)
Gather stats and daily reports will be posted to this page.
Who knows? The absence of one surely won’t.
About a year ago, several wild horses were shot on the Spruce-Pequop HMA, at the beginning of a roundup. The story was ignored by major news outlets (including Drudge) and is now totally off the radar screen.
RELATED: Clark Mountain Burro Update.
The Corolla Wild Horse Fund wants 2,000 signatures on its request to the FWS asking for a safer alternative, according to a story by WTKR News of Norfolk, VA. The petition is hosted by left wing political action group Moveon.org.
RELATED: Corolla Stallion Dies After Hitting Barbed Wire Fence.
Reward has increased to $50,000, according to 8 News Now of Las Vegas.
Note the plug by AWHC for ‘humane management practices.’ When all you have is a darting rifle, everything else looks like a mare’s butt.
RELATED: Deaths of Clark Mountain Burros in the News.
UPDATE: See this story in the Las Vegas Sun for more information on the reward.
On the Virginia Range with Nancy Kilian.
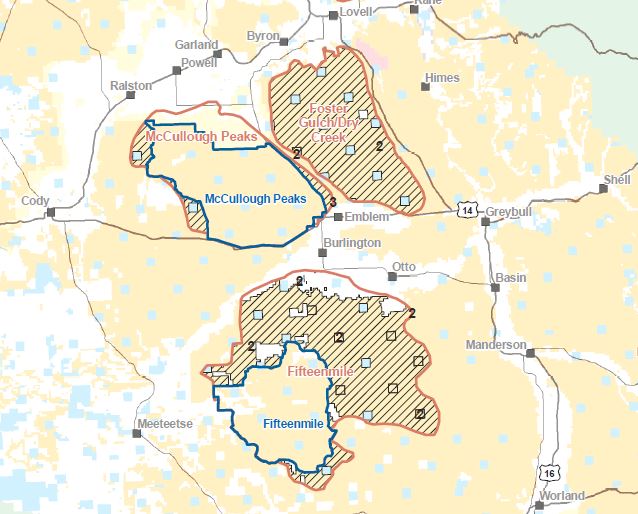
State and local officials were on hand yesterday to dedicate the Wild Horse Highway, a portion of highway 14/16/20 near the McCullough Peaks HMA in northern Wyoming.
Grant Bulltail of the Crow Nation blessed the ceremony and sang a Crow song, according to a report by KULR News of Billings, MT.
On the other side of the road is the Fifteenmile HMA, target of a roundup later this year.
RELATED: ‘Wild Horse Highway’ Created.
At the Pryor Mountain Wild Mustang Center with Venessa Carpenter.
BLM reported today that a wildfire twenty miles southeast of Alamo, NV in the Delamar Mountains was ten percent contained. The incident began Friday morning.

The map at InciWeb puts the blaze at the southwest corner of the Delamar Mountains Herd Area, one of nine HAs in the Caliente Complex (site of ongoing nuisance gather).
The news release did not indicate if any of the Delamar horses were at risk or if gather operations were affected. The area is also subject to permitted livestock grazing.
The report at InciWeb says the fire is 80% contained.
RELATED: Mustangs to Be Removed from Eastern Nevada Starting Today.
Nine days of moral depravity on the high desert, in the middle of wild horse country.

Radical inclusion, a core principle of the festival, is a leftist code word for acceptance and celebration of all manner of disease, filth and perversion. The event should not be allowed on public lands, even if it is a favorite of rich white liberals from the Bay Area.
RELATED: BLM to Renew Burning Man SRP.
BLM said today that limited opportunities for viewing the temporary holding facilities at the Antelope gather will begin on September 4. Holding activities will be open to public observation if wild horses are in the pens and the ongoing gather is not disrupted by the visitors, according to the news release.
The operation, which began on 08/10/19, has taken 393 wild horses from their home range, with five deaths. Refer to this page for details.
RELATED: Roundup Starts Next Week in Lower Half of Antelope Complex.
Statements like that are misleading and incomplete.
Truth is, public lands in the western U.S. can only support that many wild horses and burros because they’ve been consigned to ‘other mandated uses,’ such as the grazing of privately owned cattle and sheep.

Section 3 in the Original WHB Act, which calls for a ‘thriving natural ecological balance’ on public lands, orders the Secretaries of Interior and Agriculture to confer with state agencies to ensure that wildlife have access to sufficient resources and are not squeezed out by the horses and burros, especially endangered species.
“All management activities shall be at the minimal feasible level and shall be carried out in consultation with the wildlife agency of the State wherein such lands are located in order to protect the natural ecological balance of all wildlife species which inhabit such lands, particularly endangered wildlife species.”
There is no provision for domestic livestock! (That’s one of the ‘errors’ in the WHB Act that the public-lands ranchers and their political allies, mostly Democrats, ‘corrected’ when they drafted FLPMA.)
Statements about roundups and other actions, that they are required by the WHB Act of 1971, are also misleading. That statute is gone, destroyed by the ranchers.
Off-range corrals and long-term pastures are flooded with (former) wild horses and burros as a consequence.
Current herd management practices are justified by the WHB Act of 1976/1978/2004.
RELATED: Wild Horse Overpopulation?, Unwinding the Mess in the Wild Horse World.

BLM said today that rewards amounting to $18,500 have been offered for information leading to the arrest of the person(s) responsible for the deaths of over 40 wild burros in the Mojave Desert near the CA-NV border. The shootings have occurred along the I-15 corridor between Halloran Springs, CA and Primm, NV, according to the news release.
The Clark Mountain Herd Area is on the north side of the interstate, has no AML, and is not managed for wild burros. See page eight in the California HMA maps.
Curiously, the advocacy groups who supplemented the BLM reward are upset with the situation, yet they all want fewer wild horses and burros on western rangelands, either through application of contraceptives or outright removal. Shame on them.
Back-country adventure in Grayson Highlands State Park with Jonathan Lovelace.
RELATED: Free-Roaming Horses in Virginia.
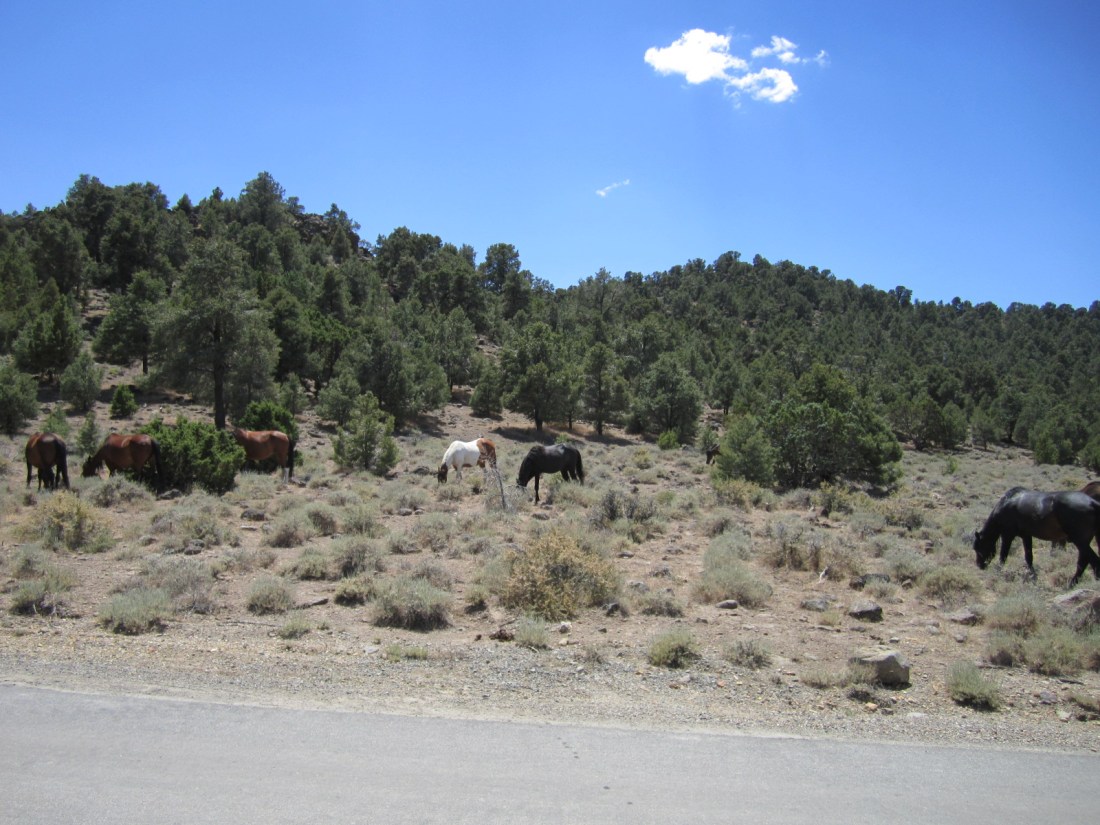
A report posted today by Carson Now says the Nevada Department of Agriculture has joined forces with Wild Horse Connection of Reno to manage the free-roaming horses of the Virginia Range.
Accordingly, WHC will respond to citizen concerns regarding public safety, including wild horse removal and adoption, diversionary feeding and installation of fencing.
The agreement follows one signed earlier this year for fertility control (PZP darting).
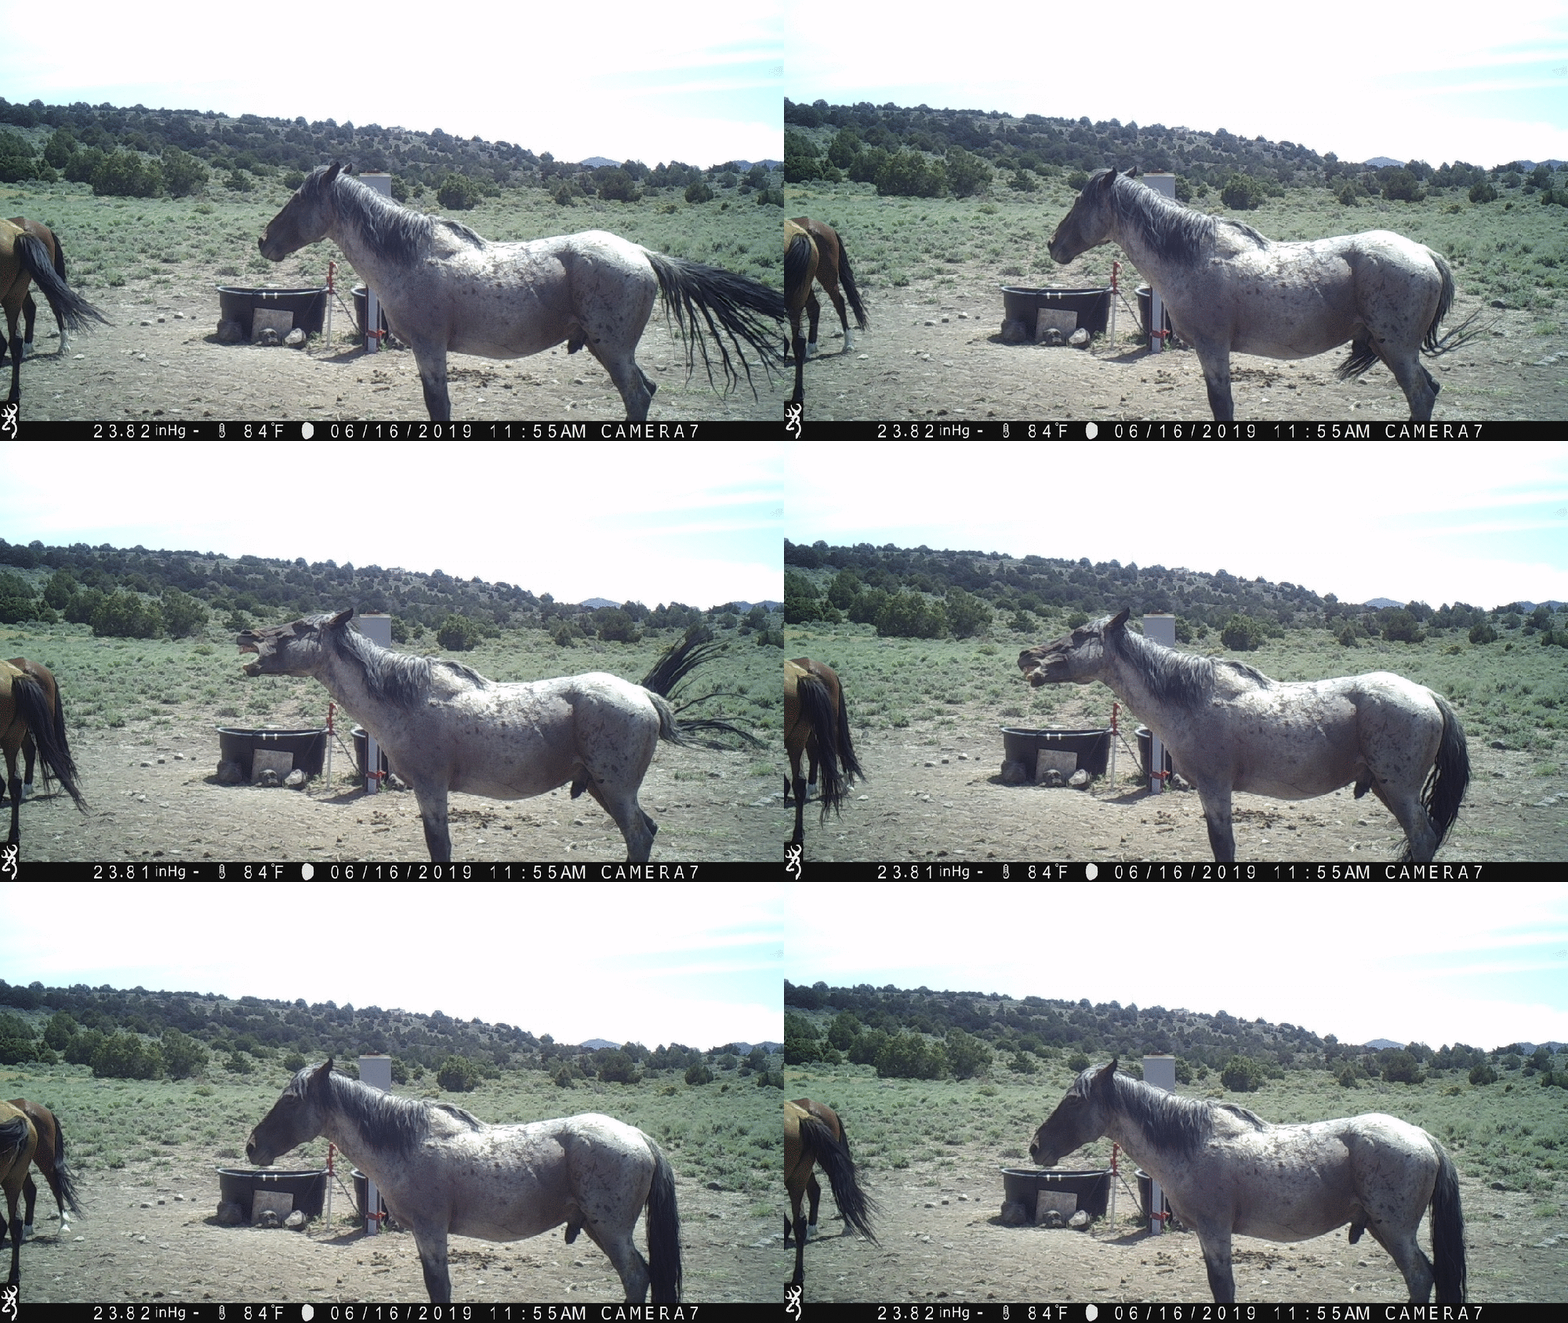
Blue roan on the Virginia Range. Or is he a bay roan?
On the Pryor Mountains Wild Horse Range with The Cloud Foundation.


