Best served with a dollop of sour cream. Figures from the wild horse and burro program data page.
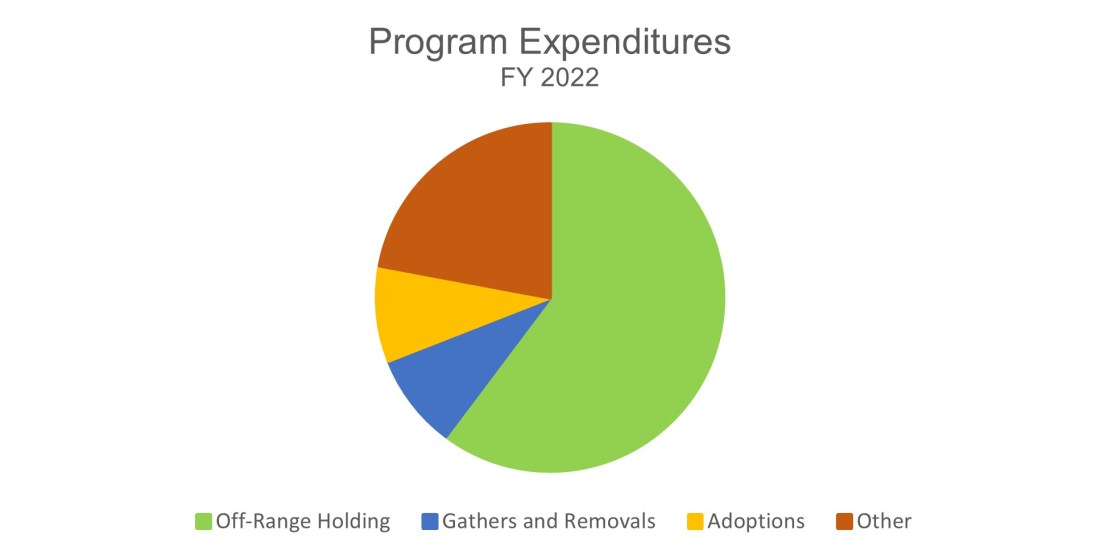
Expenditures
Off-range holding: $83.438 million
Gathers and removals: $12.186 million
Adoptions: $12.308 million
Other: $30.530 million
Off-Range Holding
Corrals (short term): 23,253
Pastures (long term): 41,116
Total (horses and burros): 64,369

Animals in Off-Range Holding
Horses: 61,438
Burros: 2,931
Total: 64,369

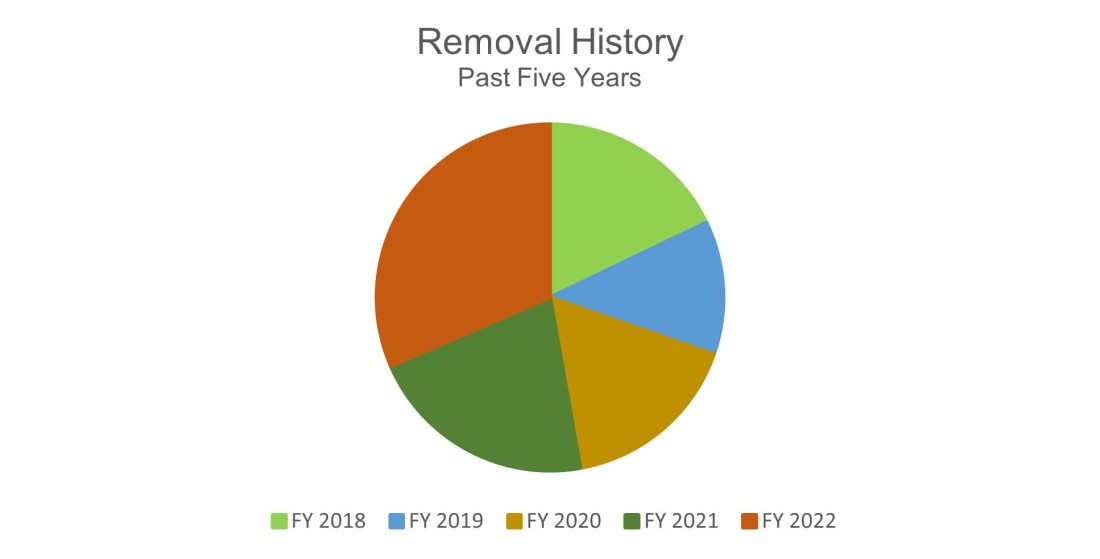
Removal History
FY 2018: 11,472
FY 2019: 7,979
FY 2020: 10,824
FY 2021: 13,666
FY 2022: 20,193
On-Range Population
Horses: 64,604
Burros: 17,780
Total: 82,384

Resource Management, the Most Important Data That Aren’t There
This is where the advocates go off the rails.
Horses and burros: Around 320,000 AUMs per year
Cattle and sheep: Not reported, estimated to be 1,280,000 AUMs per year
Wildlife: Ignored

The chart tells you that areas set aside for horses and burros can support many more animals than the government admits and explains why so many of them are are being taken off the range.
With considerable dietary overlap, you can slice the pie just about any way you want, to suit whatever interests you want to suit.
Did you think the Caliente Complex was zeroed-out because the forage was unsuitable for horses?
RELATED: The Carrying Capacity Puzzle.
