Refer to the Grazing Program Fact Sheet provided last week when proposed changes to livestock grazing regulations were announced.
Data from 2018, provided in the fact sheet, along with other relevant statistics, were copied into a spreadsheet to compare the treatment of livestock on public lands with that of wild horses.
Although privately owned cattle and sheep were allowed on those lands in addition to wild horses and burros, the calculations pertain to cow/calf pairs and horses only, for purposes of simplicity. Horses and cow/calf pairs are said to be equivalent in terms of their resource requirements.
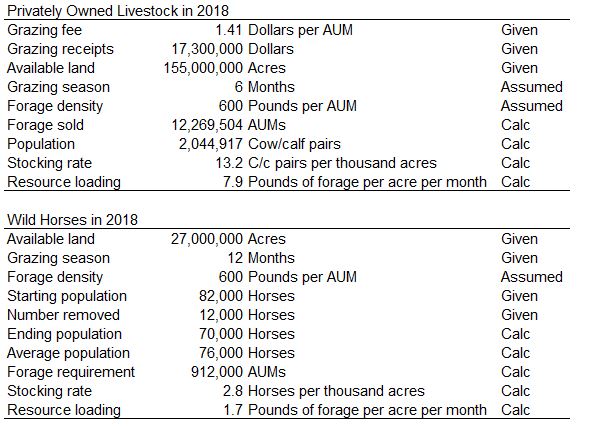
These figures are compared in the following charts. An AUM corresponds to about 600 pounds of dry forage, depending on quality and type.
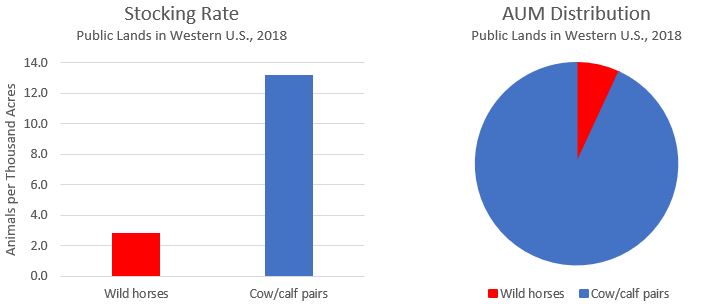
Wild horses had a much smaller footprint and environmental impact in 2018, compared to livestock, yet they were blamed for most of the problems. That is the deceit.
The AUMs consumed by the horses would support an additional 152,000 cow/calf pairs, with a value of $150 million or more, which explains why the ranchers and their allies in government want to get rid of them. That is the greed.
If the horses are denuding the landscape at a stocking rate of 2.8 per thousand acres, what do you suppose is happening when cow/calf pairs are turned out at a rate that’s almost five times higher?
RELATED: BLM to Modernize Grazing Regulations on Public Lands.
