Livestock Grazing in Wyoming

Data from the BLM rangeland grazing page and wild horse management page in Wyoming:

  • 17 million acres available to livestock
  • 5 million acres available to horses (burros not reported)
  • 1.9 million AUMs available to livestock
  • 3,725 wild horses allowed

Assuming that livestock graze six months per year, the AUM figure yields 316,000 cow/calf pairs on public lands in the state (1.9 million divided by 6).  The population density for these animals would be 18.6 cow/calf pairs per thousand acres (316,000 divided by 17 million times 1,000).

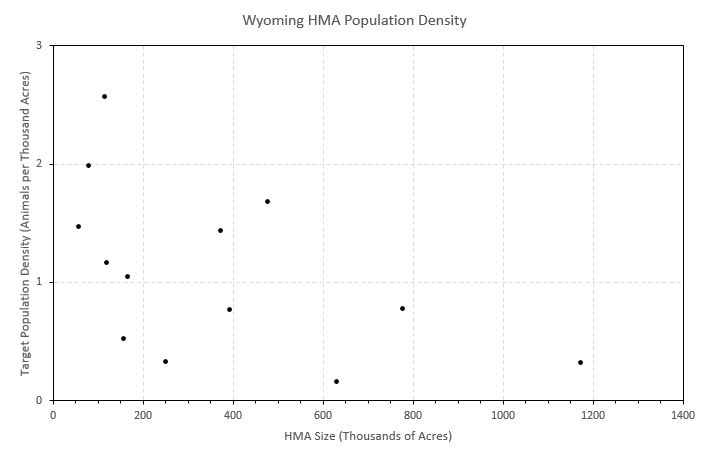
The population density for horses is 0.7 animals per thousand acres (3,725 divided by 5 million times 1,000).

Land in Wyoming can support 26 times as many cow/calf pairs as horses (18.6 divided by 0.7).  In some cases, it’s the same land!

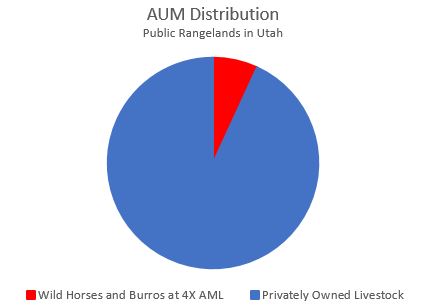
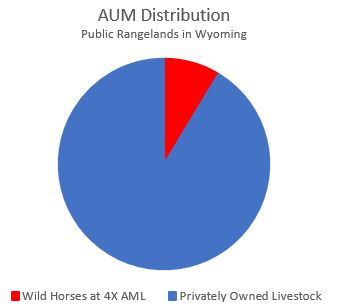
Given that horses graze twelve months per year, they would consume roughly 45,000 AUMs annually (3,725 times 12).  If they were at 4X AML they would consume less than ten percent of the forage allocated to livestock (4 times 45,000 divided by 1.9 million).

Wyoming_Livestock_Grazing-2

On hearing these results, the PZP zealots cried out “Hurry, we must dart those mares!”

RELATED: Livestock Grazing in Utah.

Livestock Grazing in Utah

Data from the BLM rangeland grazing page and wild horse management page in Utah:

  • 22 million acres available to livestock
  • 2.5 million acres available to horses and burros
  • 1.3 million AUMs available to livestock
  • 1,956 wild horses and burros allowed

Assuming that livestock graze six months per year, the AUM figure yields 216,000 cow/calf pairs on public lands in the state (1.3 million divided by 6).  The population density for these animals would be 9.8 cow/calf pairs per thousand acres (216,000 divided by 22 million times 1,000).

The population density for horses and burros is 0.8 animals per thousand acres (1,956 divided by 2.5 million times 1,000).

Land in Utah can support twelve times as many cow/calf pairs as horses and burros.  In some cases, it’s the same land!

Given that horses and burros graze twelve months per year, they would consume roughly 24,000 AUMs annually.  If they were at 4X AML they would consume less than one tenth of the forage allocated to livestock in the state.

Utah_Livestock_Grazing-1

Yet, the horses are overpopulated.  They have to go.  Livestock are blameless, always.

Pryor Mountains Adventures, Part 1

Hop in for a ride to the Pryor Mountains Wild Horse Range on the Montana-Wyoming border, one of only three areas in the western U. S. managed primarily for horses, not livestock.  Filmed in the summer of 2017.  Features the cabin visited by Ginger Kathrens in the Cloud documentary.  H/T Bigfoot Dad Explores Montana.

RELATED: Ride a Side-by-Side to See the Pryor Mountains Horses.

Wyoming HMA Stocking Rates

The chart below shows the stocking rate in animals per thousand acres as a function of land area for HMAs in Wyoming.  Stocking rates (population densities) are based on the upper values of the AMLs.

Three observations from the chart:

  • All stocking rates are less than three animals per thousand acres
  • Stocking rates are related to HMA size
  • Dispersion among stocking rates is greatest at the smaller HMAs

The largest stocking rate was found at Green Mountain HMA, 2.56.  The smallest rate corresponds to Little Colorado HMA, 0.16.

The correlation coefficient for HMA size and stocking rate is -0.53.  This statistic ranges in value from -1 to +1.  The closer the result to -1 or +1, the stronger the relationship between the two variables, in this case HMA size and stocking rate.

Wyoming_HMA_Population_Density-1

Note that the larger stocking rates are found at the smaller HMAs, while the smaller stocking rates occur at the larger HMAs, confirming the negative sign on the correlation coefficient.  A ‘shotgun’ pattern on the chart would have a correlation coefficient near zero, indicating no relationship between the two variables.

RELATED: Wyoming HMA Population.