Pinging the Desatoya Horses

Some of the horses captured in the December, 2019 roundup were to be fitted with GPS radio transmitters and returned to the HMA, according to NEPA Project DOI-BLM-NV-C010-2020-0004-CX, but the news release announcing the end of the incident doesn’t mention it.

The transmitters were to be braided into their tails, according to Attachment 1 of the Categorical Exclusion approved in November, 2019.

The 127 horses remaining after the roundup have blossomed to 215 in less than a year, according to Section 1.2 of the Draft EA for the new resource enforcement plan.

RELATED: New Desatoya Gather Plan Available for Review.

House Spending Bill Increases WHB Funding

The FY 2021 Omnibus Appropriations and Coronavirus Relief Package, passed by the House yesterday, increases spending for the wild horse and burro program by $14 million, compared to FY 2020, according to the Division G explanatory statement.

That division covers the Department of the Interior (BLM), Environmental Protection Agency, Forest Service and related agencies.

The funds “are in response to the Bureau’s May 15, 2020 proposal to institute an aggressive, non-lethal population control strategy to address the current unsustainable trajectory of on-range wild horse and burro population growth.”

The other 11 divisions can be accessed in a news release dated December 21 by the House Committee on Appropriations.

Family, Freedom Overrated

Roundups are not necessarily a bad thing for wild horses, according to the writer of the Sac Bee article, because humans will “find them loving homes and a life of fresh hay, warm barns and veterinary care.”

No more hooves stuck in cattle guards.

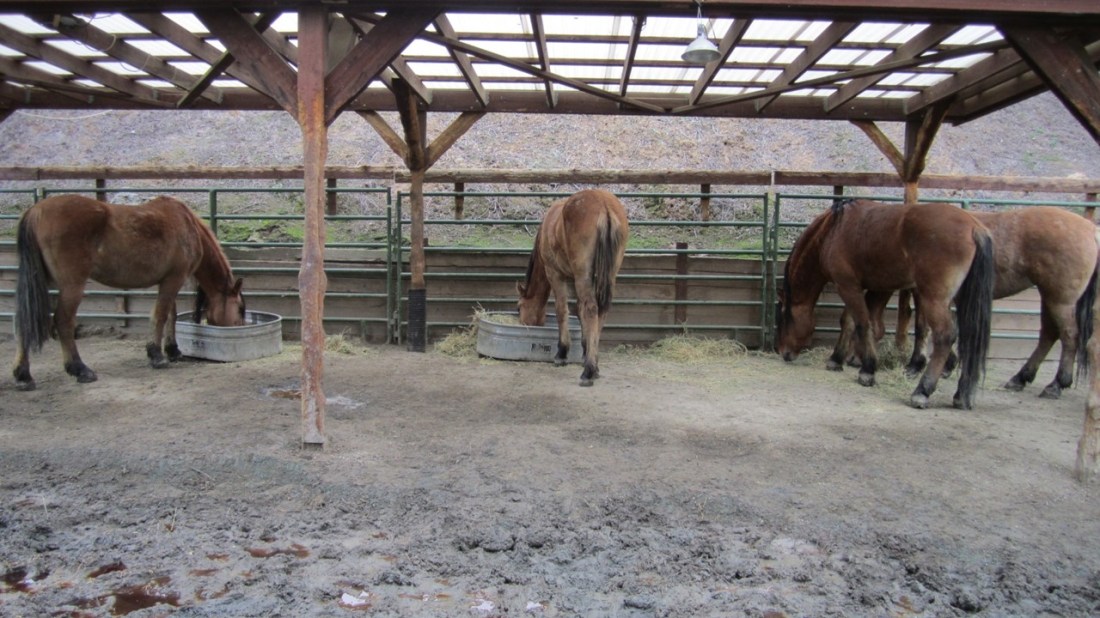
Instead, they’ll be locked in stalls and fed a steady diet of bits, spurs, tiedowns, blankets, braided tails and maybe even shoes, everything they dreamed of while on the range.

And, of course, everybody has a heated barn with running water, except the host of Western Horse Watchers.

RELATED: Sac Bee Publishes Hit Piece On Wild Horses.

Corral 12-21-20-1

Desatoya Wild Horses Get Short End of Stick

The Desatoya HMA covers 157,836 acres of public lands in central Nevada and has an AML of 180.  The stocking rate allowed by plan is 1.1 horses per thousand acres, slightly more than the average rate of one animal per thousand acres across all areas managed for wild horses and burros.

The horses allowed by plan require 180 × 12 = 2,160 AUMs per year.

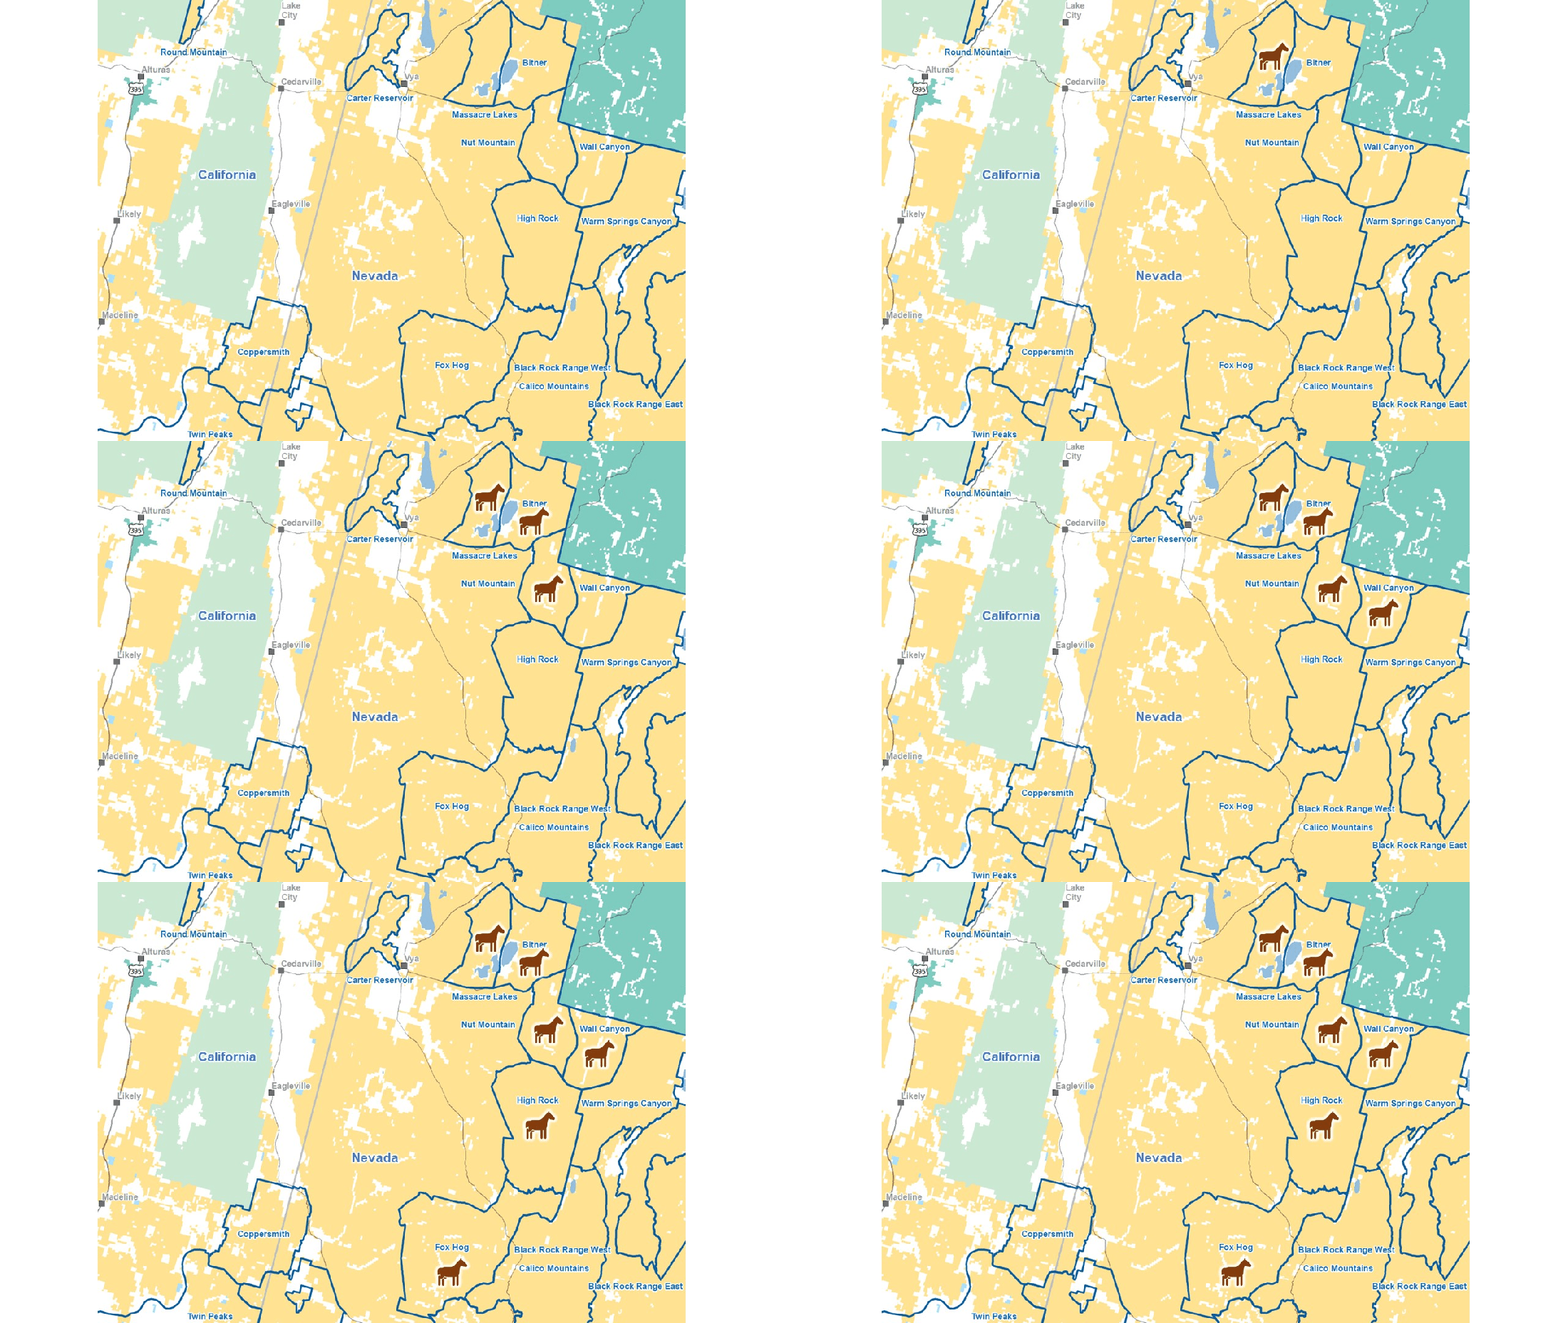
The HMA intersects four grazing allotments.  Table 3-2 in the Draft EA for wild horse management actions provides grazing seasons and permitted forage inside the HMA but does not provide the allotment sizes.  Those were obtained from the Allotment Master in the Rangeland Administration System.

Desatoya Allotment Map-1

Three of the allotments are managed by the Stillwater Field Office and one is managed by the Mount Lewis Field Office.

Although cattle and sheep are allowed, the following calculations are based on cow/calf pairs only, for a direct comparison to wild horses.  The resource requirements of wild horses and cow/calf pairs are said to be equivalent.

The total allotment acreage inside the HMA is approximately equal to the size of the HMA so the HMA was assumed to be 100% subject to permitted grazing.

Desatoya HMA Calcs-1

The Clan Alpine permittees would have to place 851 cow/calf pairs inside the allotment to graze off 10,210 AUMs in 12 months.  The Porter Canyon permittee would have to place 605 cow/calf pairs inside the allotment to consume 7,256 AUMs in 12 months.

Note that the stocking rates (densities) for the allotments are several times larger than that for wild horses, consistent with an observation made earlier that productivity goes up when land is designated for livestock.

The forage available to livestock inside the HMA was provided in Table 3-2, so no calculations are required in that column.  The total across the four allotments is 9,608 AUMs per year.

The Porter Canyon permittee would have to place 529 cow/calf pairs inside the HMA to consume 6,352 AUMs in 12 months.  The total number of cow/calf pairs allowed by plan inside the HMA is 811 and the weighted average grazing season is 11.8 months per year, almost identical to that of the horses.

The stocking rate allowed by plan is 811 ÷ 157,836 × 1,000 = 5.1 cow/calf pairs per thousand acres.

These figures are compared in the following charts.

Desatoya HMA Charts-1

The HMA—an area set aside for wild horses—is managed primarily for livestock, with the horses receiving just 18% of the authorized forage, excluding wildlife.

The forage assigned to livestock would support an additional 801 horses, for a true AML of 981.

The current population of 215 horses, according to Section 1.2 of the EA, is well within that range, so there are no excess animals and there is no justification for a roundup or fertility control program.

However, given the current management philosophy, and the absence of any meaningful opposition by the so-called advocacy groups, those will be the preferred methods for enforcing the resource allocations and improving rangeland health.

RELATED: New Desatoya Gather Plan Available for Review.

Confusion Roundup In the News

A BLM public affairs officer told the St. George News that the “nonreproduction component” is still an “if,” but does not say why.

She noted that adoptions have declined this year due to changes in the economy, even though the $1,000 incentive is still available.

The adoption program is now called the private care program, according to the story.

RELATED: Confusion Roundup Over?, Confusion Lawsuits In the News.

Economic Benefit of Public-Lands Ranching in Wild Horse Areas?

The federal government sells about 12 million AUMs per year to public-lands ranchers, across 155 million acres, mostly in the western U.S.

That transaction generates about $16 million per year in revenue for the government, which manages those lands—supposedly—for the benefit of the American people.

How much of that income is produced in areas identified for wild horses and burros?

One way to answer the question is to scale the revenue according to acreage.

The management plans assign 27 million acres to horses and burros, approximately 17% of the land authorized for grazing.  The estimated revenue would be .17 × 16 = $2.7 million per year.

Another approach would be to consider the resource allocations in areas designated for wild horses and burros, where the plans allow 27,000 of them.  Data reviewed on these pages suggest that livestock receive eighty to eighty five percent of the forage, excluding wildlife.  That means they receive four to five times as much as the horses and burros.

If that’s true in other areas, the forage assigned to livestock in areas identified for horses and burros would be 27,000 × 12 × 5 = 1.6 million AUMs per year, worth $2.2 million per year at current prices.

Not much of an offset for the tens of millions of dollars spent every year—confiscated from American wage earners—to remove and warehouse the horses and burros, so the ranchers can enjoy more of what their allotments have to offer.

The major economic benefit accrues at harvest time.  Of course, those revenues stay with the ranchers and their overlords, not the American people.

It’s redistribution of wealth, classic socialism.  That’s what the farm bureaus, stockgrower’s associations and cattlemen’s groups are trying to defend.

What the CAWP Can’t Do

The program can’t change the resource allocations that leave America’s wild horses and burros with crumbs, necessitating their removal from public lands in favor of privately owned livestock.

So as the roundups accelerate and the ‘Path Forward‘ is put into practice, know that the animals are being treated humanely—even the ones that don’t survive—while cattle and sheep graze peacefully on land that belongs to them.

RELATED: BLM Reaffirms Commitment to CAWP.

Pancake Gather Plan

How to Compute Wild Horse Growth Rates

The relationship between initial and final herd sizes, assuming compound growth, is

Initial herd size × (1 + x) ^ n = Final herd size

where x is the annual growth rate and n is the time interval in years.  The caret (^) signifies exponentiation, one plus x raised to the nth power.

Solving for x,

x = 10 ^ [1 ÷ n × log(Final herd size ÷ Initial herd size)] – 1

Multiply the result by 100 to obtain a growth rate in percent per year.

The math is a little tedious to do by hand so let’s set it up in a spreadsheet.

Wild Horse Growth Rates Set-Up-1

In Excel, the formula in cell B9 is =100*(10^(1/B7*LOG(B5/B3))-1).  The other cells are just text and numbers.  If you use different cells for the data, the formula won’t work.

You can copy the formula and paste it into your spreadsheet, starting with = but don’t include the period.  The number format for cell B9 was set to one decimal place.

The post from December 16 included two examples.  In the second case, a herd of 100 wild horses becomes a herd of 201 wild horses in five years if the annual growth rate is 15% per year.  Those numbers were used to test the spreadsheet.

AMLs are often specified as a range, with the lower end about half of the upper end, to allow for a doubling of the herd size in four or five years.

The proposed AML for the Heber WHT is 50 – 104.  If you start with 50 wild horses and find 104 wild horses in four years, what was the annual growth rate?

The Heber AML is discussed on page 21 of the new management plan.

RELATED: More On Growth Rates.

Delamar Roundup Day 11

The incident began on December 6.  Gather stats through December 16:

  • Horses captured: 405
  • Goal: 414
  • Returned: 0
  • Deaths: 21
  • Shipped: 263

Helicopters were grounded on Day 10 due to weather.

Two horses were put down on Day 9 and three on Day 10 due to pre-existing conditions, bringing the death rate to 5.2%.

Foals accounted for 15.3% of the horses gathered.  Roughly 50% of captured adults were males and 50% were females.

Body condition scores are not known.

The number of horses shipped is 287 according to the gather page.  No shipments were reported on Day 11.

The number of unaccounted-for animals is 121.  The operation will likely conclude in another day or two.

RELATED: Delamar Roundup Day 8.

Heber Wild Horses: Setting Them Up for Failure?

A bachelor stallion chases a mare and foal as they leave a water hole in the following video by Friends of the Heber Wild Horses.  The fence is for livestock.

A management plan, drafted earlier this year, shows the WHT boundary relative to those of the allotments, page 10 in the pdf.  The proposed AML is discussed on page 21.

The AML for areas outside the WHT is zero, meaning the horses could be captured and removed from the forest if someone complains or they create a hazard.

When grazing season begins, gates are closed, and the horses are cut off from some of their food and water, perhaps a sizeable amount.

If they can’t access critical resources inside their designated area, they’ll move beyond it in search of new ones.  Gotcha!

This approach to wild horse management is not unique to the WHT.  It’s standard practice for most of the wild horse areas on western rangelands.  The new Desatoya resource enforcement plan, currently out for review, is another example.

The environmental assessment for the Heber management plan should be available for public review in early 2021, according to the project status.

RELATED: Heber EA in Progress.

More On Growth Rates

Table 1 of the Draft EA for resource enforcement in the Pancake Complex shows current wild horse populations in the four areas that make up the Complex.

The paragraph immediately below says the upper end of the population range is based on a 2016 survey, plus four years of compounded 20% annual growth.

If you start off with 100 horses and the growth rate is 20% per year, how large will the herd be after four years?

At the end of the first year, you’ll have 100 × 1.2 = 120 wild horses.  At the end of the second year, you’ll have 120 × 1.2 = 144 wild horses.  At end of year three, you’ll have 144 × 1.2 = 173 horses.

That is the idea of compounding.

At the end of year four, you’ll have 100 × 1.2 × 1.2 × 1.2 × 1.2 = 207 horses.  Herd sizes double in four years at a 20% annual growth rate.

If the growth rate is 15% per year, a herd of 100 wild horses would become a herd of 100 × 1.15 × 1.15 × 1.15 × 1.15 × 1.15 = 201 wild horses in five years.

That’s why the BLM says herd sizes double every four to five years.

RELATED: Wild Horse Growth Rates.