Figures can be found in the Program Budget section of the Program Data page.
In 2024, the BLM spent 2.3 times as much for off-range holding as it did in 2012.
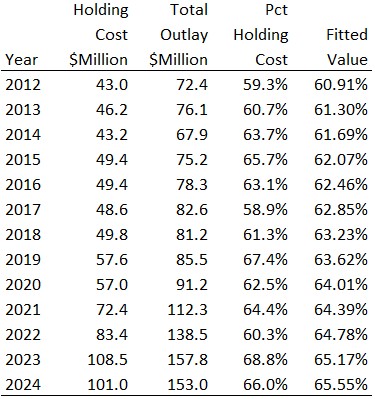
But as a percentage of total expenditures, are the costs really going up or just escalating with everything else?
A run chart provides some evidence of an increase.

The trendline, in black, also appears to be going up. It was fitted to the data with the Analysis Toolpak in Excel.
However, the ANOVA table provided by the toolpak tells a different story.
The p-value of the F-statistic is .095—too large to conclude that the passage of time, on the x-axis, is of use in explaining the variations in the percentage, on the y-axis.
Although there is some evidence of a long-term increase, it’s not enough to provide a basis for action. A p-value smaller than .01 might signal adverse change.
The advocates, on the other hand, believe the costs are spiraling out of control and use the narrative to push their ruinous darting programs.
