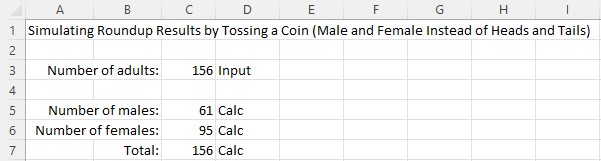
The roundup took 57 stallions and 99 mares off the range, for a total of 156.
Yesterday your host suggested it would be very hard to reproduce those results by tossing coins.
The conclusion arises from a statistical calculation where p-bar = .5 and n = 156.

The observed proportions of males and females fall outside these limits. That is, they don’t look like they came from a random process centered at 50% males / 50% females.
That statement could be tested by tossing a coin 156 times with many replications.
Another option is to simulate the tosses in an Excel spreadsheet using the built-in random number generator, counting the number of males and females in each replicate.
Enter 156 into cell C3. Then press F9 repeatedly to see the distribution of results.
Can you come up with 57 or less males and 99 or more females?
It may be possible but it won’t happen very frequently.
Your host was able to achieve 61 and 95.
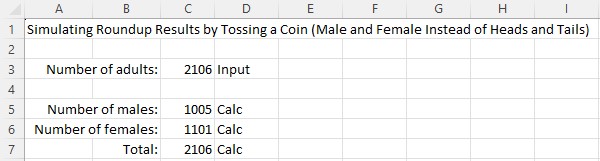
The North Lander roundup took 1,005 stallions and 1,101 mares off the range for a total of 2,106.
Western Horse Watchers was able to achieve those results exactly, meaning they look like they came from a random process centered at 50% males / 50% females.
The spreadsheet limit is 5,000 adults.
You can also try this for the Blue Wing roundup, which has taken 447 stallions and 460 mares off the range as of July 26.
RELATED: Reproducing the Swasey Gather Results.
