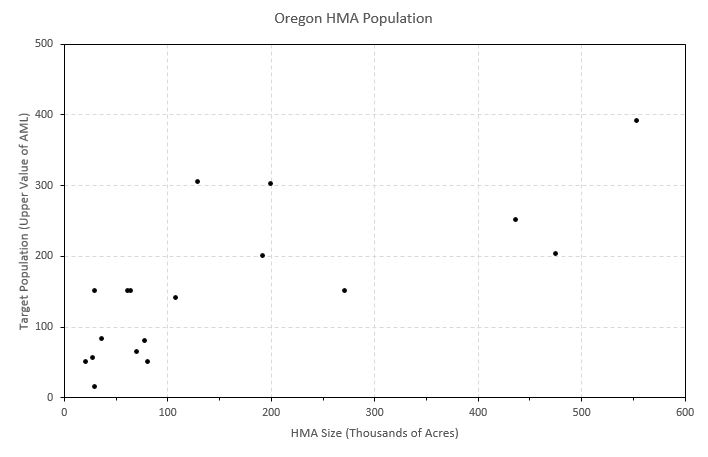
The chart below shows the population target for HMAs in Oregon as a function of HMA size.
The chart yields three conclusions:
- Almost two thirds of the HMAs are smaller than 100,000 acres
- Most of the AMLs are 200 animals or less
- AMLs vary with HMA size but not proportionately
Imagine a line starting at (0, 0) and extending diagonally to the right. The average size of HMAs less than 100,00 acres is about 50,000 acres. The average AML for that subgroup is roughly 85 animals. Therefore, line would pass through (50, 85).
Now let x = 500. The proportional AML should be ten times larger, y = 10 × 85 = 850, establishing another point at (500, 850). The three HMAs close to x = 500 have AMLs far less than 850.
This leads to the topic of population density (subject of next post in the series). If you’re expecting to find some of the smaller densities (animals per thousand acres) on the larger HMAs, you’d be right. That is the same pattern observed in Nevada.
RELATED: Oregon HMA Stats.
